In short
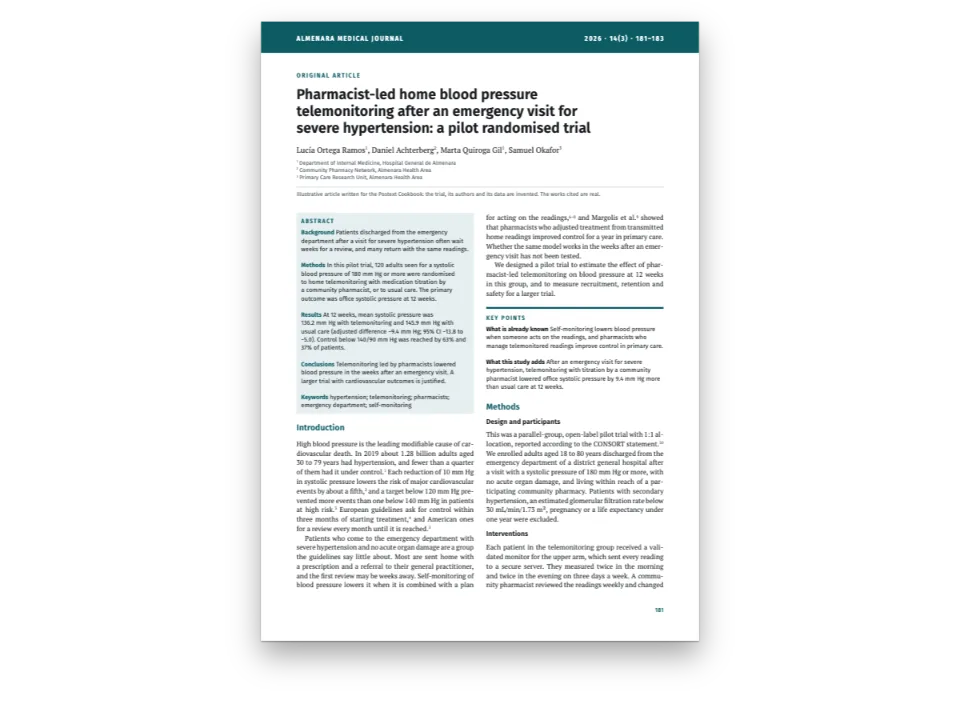
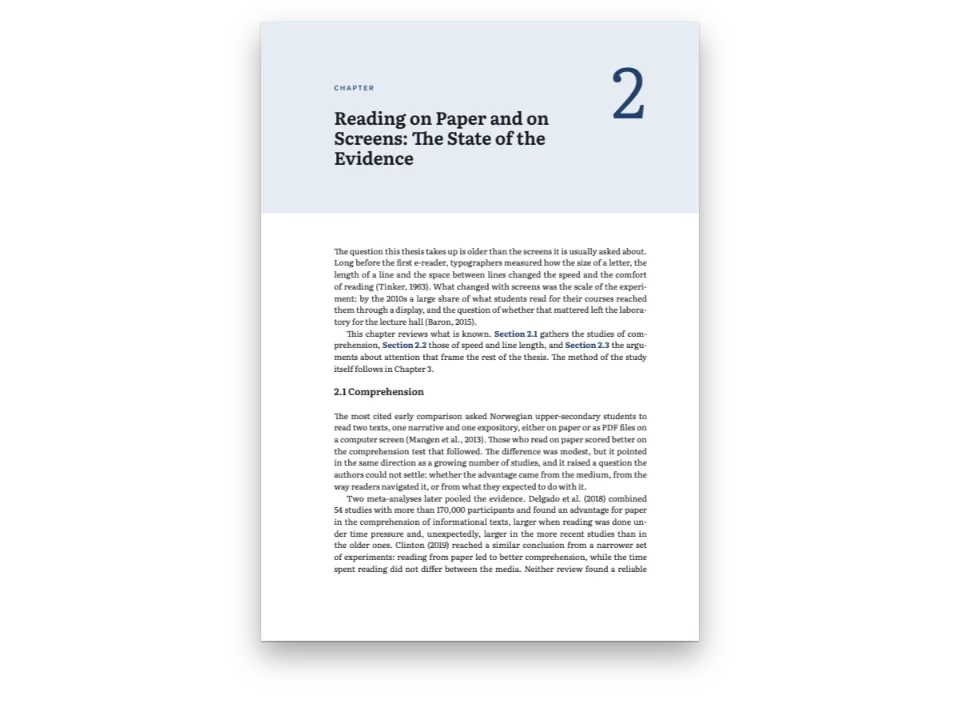
A published study of a chatbot that offers therapy exercises, shortened and laid out again. The flow chart of who joined and left the trial is drawn from its numbers, the tables keep their decimals in line and the references follow APA.
What you'll build
A randomized controlled trial from digital mental health, re-set from its open-access text: the 2017 JMIR Mental Health trial of Woebot, a conversational agent that delivers cognitive behavior therapy, abridged to eight pages. The house style is a calm research report on 210 × 280 mm, Lora for the text and Nunito Sans for every label and number, with one indigo accent. The pages carry what a trial report needs: the structured abstract across both columns, keywords and a registration line, the CONSORT participant flow redrawn in code from the paper's own numbers, two outcome tables whose decimals line up, the authors' conflict of interest kept word for word, and APA 7 author–date citations built from BibTeX.
This recipe answers
- How do I draw a CONSORT flow diagram and set a structured abstract for a clinical trial report?
- How do I make a table with header rows, merged cells, column widths and per-cell alignment?
- How do I cite works and build the bibliography in APA, IEEE or another citation style?
- How do I re-set an open-access paper from arXiv or PubMed Central with Postext, keeping its citations, figures and licence line?
The short answer
// The abstract is a box whose span is 'page': the columns close above it and open again
// under it. Inside, :::columns sets Background to Results in two columns; the keywords and
// the registration line run across the box under them.
const abstractBox = { id: 'abstract', span: 'page', background: col('tint'),
  padding: { top: mm(3.5), right: mm(4.5), bottom: mm(3), left: mm(4.5) },
  marginTop: pt(0), marginBottom: pt(LEAD), columnGap: mm(7),
  titleStyle: { fontFamily: SANS, fontSize: pt(8.5), fontWeight: 800, letterSpacing: pt(1.6),
    textTransform: 'uppercase', color: col('accent'), gap: mm(2) },
  body: { fontFamily: SANS, fontSize: pt(8.4), lineHeight: pt(11.4), textAlign: 'left',
    firstLineIndent: pt(0), paragraphSpacing: true, boldColor: col('accent'),
    boldFontWeight: 800, italicColor: col('ink') } };
// The CONSORT diagram is an SVG drawn in code from the trial's numbers (see #region art),
// declared as a resource and placed by its first :ref, at the head of the next page.
const consort = { id: 'fig-consort', typeId: 'figure', kind: 'svg', createdAt: 0, updatedAt: 0,
  placement: { position: 'top', span: 'page' },
  svg: { fileId: 'consort.svg', width: 1760, height: CONSORT_H * 10 },
  caption: 'Participant flow through the trial (CONSORT diagram).',
  note: 'Redrawn from Figure 1 of the original; the Analysis row follows the Statistical '
    + 'Analysis section. The text reports 58 participants with T2 data.',
  altText: 'Flow chart: 204 registrations, 115 confirmed, 45 excluded as bot-generated, 70 '
    + 'randomized; 34 to Woebot (3 lost, 31 with T2 data) and 36 to the information-only '
    + 'control (11 lost, 25 with T2 data); 34 and 36 analysed.' };
A structured abstract across both columns, and a figure drawn from numbers
Ingredients
- Features
- Figures and tables as resourcesBoxes across the pageTables from dataCitations that place figuresFigure placementCaption styleSource and credit linesColumns in a box or in the textNested boxesTable styleCitations in a citation styleBibliography from the referencesHeading stylesDesigned openersHeading attributesRunning heads and foliosSuperscripts and subscriptsParagraph stylesSemantic colour palettePDF export
- Also uses
- Callout boxesFigure and Table in your languageMathematicsHeads by page roleFonts embedded in the PDFCustom resource typesUnnumbered chaptersExplicit vertical space
- Type
- Lora, Nunito Sans (SIL OFL 1.1)
- Assets
- None: every picture is drawn in code
Method
#1 · The abstract box and the diagram as a resource
The code is the short answer above. A box style with span: 'page' closes the two columns above it and opens them again under it, so the abstract can sit across the page at any height. Inside it, :::columns{count=2} sets Background to Conclusions in two columns, and the keywords and the registration line follow across the full width of the box. The CONSORT diagram is an SVG resource like any other: it gets its number, caption and credit note from the resource, and its first :ref places it at the head of the next page.
#2 · The article head from heading attributes
const text = (id, content, family, size, extra) => ({ kind: 'text', id, content, align: 'left',
  fontFamily: family, fontSize: pt(size), color: col('ink'), overflow: 'wrap', ...extra });
const at = (to, edge, x, y, width) => ({ anchor: { to, edge }, offset: { x: mm(x), y: mm(y) },
  ...(width && { size: { width: mm(width), height: 'auto' } }) });
const caps = { fontFamily: SANS, fontWeight: 800, letterSpacing: pt(1.5),
  textTransform: 'uppercase' };
const titleBlock = { enabled: true, minHeight: mm(70), slot: { elements: [
  { kind: 'rule', id: 'bar', thickness: pt(2.5), color: col('accent'),
    placement: at('container', 'top-left', 0, 0, MEASURE) },
  text('kind', '{attr.kind}', SANS, 8, { ...caps, color: col('accent'),
    placement: at('#bar', 'below', 0, 3, MEASURE) }),
  text('title', '{titleText}', SERIF, 18.5, { fontWeight: 700, lineHeight: 1.17,
    placement: at('#kind', 'below', 0, 3.5, MEASURE - 8) }),
  text('authors', '{attr.authors}', SANS, 10, { fontWeight: 700, inlineMarks: true,
    placement: at('#title', 'below', 0, 4.5, MEASURE) }),
  text('affiliations', '{attr.affiliations}', SANS, 7.4, { inlineMarks: true, lineHeight: 1.4,
    color: col('muted'), placement: at('#authors', 'below', 0, 1.8, MEASURE) }),
  { kind: 'rule', id: 'hair', thickness: pt(0.5), color: col('rule'),
    placement: at('#affiliations', 'below', 0, 2.6, MEASURE) },
  text('history', '{attr.history}', SANS, 7.2, { color: col('muted'),
    placement: at('#hair', 'below', 0, 1.6, MEASURE) }),
  text('source', '{attr.source}', SANS, 7.2, { fontWeight: 700, color: col('accent'),
    placement: at('#history', 'below', 0, 0.8, MEASURE) }),
] } };
The title is the document's only level-1 heading, with a style that spans the page and draws it from elements. Everything else in the head comes from heading attributes: the article type, the authors with ^1^ affiliation marks that inlineMarks raises, the affiliations split by \n, the received and accepted dates and the source line. For your own paper you change the attributes and keep the design. numbered: false on the style keeps the figures at Figure 1, 2, 3 instead of 1.1.
#3 · The CONSORT flow, drawn from the numbers
const n2 = (v) => +v.toFixed(2);
const esc = (s) => s.replace(/&/g, '&').replace(/</g, '<');
// The labels' family, named on the root element: loadSvg embeds its faces.
const LABELS = `font-family="${SANS}"`;
const label = (x, y, s, size, weight, fill, anchor = 'middle') => `<text x="${n2(x)}" `
+ `y="${n2(y)}" font-size="${size}" font-weight="${weight}" fill="${fill}" `
+ `text-anchor="${anchor}">${esc(s)}</text>`;
// A box of centred lines: the first bold, "n = …" bold in the accent (white on a
// filled box), the rest regular.
function node(cx, y, w, lines, { size = 2.6, fill = palette.tint, stroke = palette.accent } = {}) {
const lh = size * 1.3;
const h = lines.length * lh + 2.2;
const solid = fill === palette.accent;
let svg = `<rect x="${n2(cx - w / 2)}" y="${n2(y)}" width="${w}" height="${n2(h)}" rx="1.2" `
+ `fill="${fill}" stroke="${stroke}" stroke-width="0.3"/>`;
lines.forEach((s, i) => {
const isN = /^n = /.test(s);
svg += label(cx, y + 1.1 + lh * (i + 0.78), s, size, i === 0 || isN ? 800 : 400,
solid ? palette.paper : isN ? palette.accent : palette.ink);
});
return { svg, h, top: y, bottom: y + h, mid: y + h / 2 };
}
// Arrows are a line plus a filled triangle path: no <marker> (gotcha: svg-no-marker-filters).
const line = (pts) => `<path d="M${pts.map(([x, y]) => `${n2(x)} ${n2(y)}`).join('L')}" `
+ `fill="none" stroke="${palette.ink}" stroke-width="0.3"/>`;
function arrow(pts) {
const [[x0, y0], [x1, y1]] = pts.slice(-2);
const a = Math.atan2(y1 - y0, x1 - x0);
const p = (d, s) => `${n2(x1 - Math.cos(a) * d + Math.sin(a) * s)} `
+ `${n2(y1 - Math.sin(a) * d - Math.cos(a) * s)}`;
return line([...pts.slice(0, -1), [x1 - Math.cos(a) * 1.4, y1 - Math.sin(a) * 1.4]])
+ `<path d="M${n2(x1)} ${n2(y1)}L${p(1.8, 0.9)}L${p(1.8, -0.9)}Z" fill="${palette.ink}"/>`;
}
// The four CONSORT stages as pills at the left edge, each centred on a y.
const stage = (y, s) => `<rect x="0" y="${n2(y - 2.2)}" width="${n2(s.length * 1.9 + 5)}" `
+ `height="4.4" rx="2.2" fill="${palette.ink}"/>`
+ label(2.5, y + 0.85, s.toUpperCase(), 2.3, 800, palette.paper, 'start');
function consortSvg(face) { // 176 mm wide, the full measure; one unit is a millimetre
const [W, L, R, MID] = [176, 59, 117, 88];
const side = { size: 2.5, fill: palette.paper, stroke: palette.rule };
const a = node(MID, 0.5, 64, ['Registrations received by email', 'n = 204']);
const b = node(MID, a.bottom + 3, 64, ['Responded to the email confirmation', 'n = 115']);
const x = node(150, b.bottom + 0.5, 52, ['Excluded as ineligible', 'n = 45',
'deemed bot-generated'], side);
const c = node(MID, x.bottom + 2, 64, ['Randomized by computer algorithm', 'n = 70'],
{ fill: palette.accent });
const split = c.bottom + 4; // the line that divides the sample between the arms
const parts = [a.svg, b.svg, x.svg, c.svg, stage(a.mid, 'Enrollment'),
arrow([[MID, a.bottom], [MID, b.top]]), arrow([[MID, b.bottom], [MID, c.top]]),
arrow([[MID, x.mid], [124, x.mid]]), stage(split, 'Allocation'),
line([[MID, c.bottom], [MID, split]]), line([[L, split], [R, split]])];
const arms = [[L, 13, 'Allocated to Woebot', 34, 'up to 20 sessions over 2 weeks', 3, 31],
[R, 163, 'Allocated to information-only control', 36, 'NIMH ebook on depression', 11, 25]];
for (const [cx, sx, title, n, what, gone, kept] of arms) {
const box = node(cx, split + 3.5, 56, [title, `n = ${n}`, what]);
const lost = node(sx, box.bottom + 4.5, 26, ['Lost to follow-up', `n = ${gone}`], side);
const t2 = node(cx, lost.bottom + 2, 56, ['Provided data at T2', `n = ${kept}`]);
const an = node(cx, t2.bottom + 5.5, 56, ['Analysed (intention to treat)', `n = ${n}`,
'missing T2 data imputed'], { fill: palette.accent });
parts.push(box.svg, lost.svg, t2.svg, an.svg, arrow([[cx, split], [cx, box.top]]),
arrow([[cx, box.bottom], [cx, t2.top]]), arrow([[cx, lost.mid], [sx + (sx < MID ? 13
: -13), lost.mid]]), arrow([[cx, t2.bottom], [cx, an.top]]));
if (cx === R) parts.push(stage(lost.top - 3, 'Follow-up'), stage(t2.bottom + 2.75, 'Analysis'));
}
return `<svg xmlns="http://www.w3.org/2000/svg" width="1760" height="${CONSORT_H * 10}" `
+ `viewBox="0 0 ${W} ${CONSORT_H}" ${face}>${parts.join('')}</svg>`;
}
// The thematic maps (Figs 3, 4) as bars.
const THEMES = [
{ id: 'fig-best', file: 'best.svg', themes: [['Process', 31, [['Checking in / accountability', 9],
['Empathy / personality', 7], ['Learning', 12, [['Emotions', 5], ['General insight', 5],
['Cognitions', 2]]], ['Conversation', 3]]], ['Content', 16, [['Videos', 7], ['Games', 3],
['Suggestions', 2], ['Weekly graphs', 1]]]],
caption: 'Best features of the Woebot experience: themes of the answers to “What was the best '
+ 'thing about your experience using Woebot?”',
note: 'Number of participants per theme. Redrawn as bars from the thematic map in Figure 3 of '
+ 'the original; numbers as printed there.',
alt: 'Bars for Process (31): checking in 9, empathy 7, learning 12 (emotions 5, general '
+ 'insight 5, cognitions 2), conversation 3; Content (16): videos 7, games 3, suggestions 2, '
+ 'weekly graphs 1.' },
{ id: 'fig-worst', file: 'worst.svg', themes: [['Process violations', 15,
[['Not being able to converse naturally', 10], ['Repetitive', 2], ['Miscellaneous', 3]]],
['Technical problems', 8, [['Glitches', 4], ['Looping', 4]]], ['Content', 8,
[['Emoticons', 2], ['Interactions too short', 2], ['Videos too long', 2], ['Other', 2]]]],
caption: 'Least favored experiences: themes of the answers to “What was the worst thing about '
+ 'your experience of using Woebot?”',
note: 'Number of participants per theme. Redrawn as bars from the thematic map in Figure 4 of '
+ 'the original; numbers as printed there.',
alt: 'Bars for Process violations (15): not conversing naturally 10, repetitive 2, '
+ 'miscellaneous 3; Technical problems (8): glitches 4, looping 4; Content (8): emoticons, '
+ 'short interactions, long videos and other, 2 each.' },
];
const rows = (themes) => themes.flatMap(([name, n, subs]) => [{ name, n, depth: 0 },
...subs.flatMap(([s, k, deeper = []]) => [{ name: s, n: k, depth: 1 },
...deeper.map(([d, m]) => ({ name: d, n: m, depth: 2 }))])]);
const ROW = 4.4;
function themeHeight(id) { return rows(THEMES.find((f) => f.id === id).themes).length * ROW + 2; }
function themeSvg({ id, themes }, face) { // 84.5 mm wide: one column
const [W, X0, X1] = [84.5, 48, 79];
const H = themeHeight(id);
let svg = '';
rows(themes).forEach(({ name, n, depth }, i) => {
const y = 1 + i * ROW;
if (!depth) {
svg += `<path d="M0 ${n2(y + 0.2)}H${W}" stroke="${palette.rule}" stroke-width="0.25"/>`
+ label(0, y + 3.1, `${name} (${n})`, 2.75, 800, palette.ink, 'start');
return;
}
const w = (n / 12) * (X1 - X0);
svg += label(depth * 3 - 1, y + 3, name, 2.45, 400, palette.ink, 'start')
+ `<rect x="${X0}" y="${n2(y + 0.9)}" width="${n2(w)}" height="2.6" `
+ `fill="${depth === 1 ? palette.accent : palette.soft}"/>`
+ label(X0 + w + 1.2, y + 3, String(n), 2.55, 800, palette.ink, 'start');
});
return `<svg xmlns="http://www.w3.org/2000/svg" width="845" height="${Math.round(H * 10)}" `
+ `viewBox="0 0 ${W} ${n2(H)}" ${face}>${svg}</svg>`;
}
Each box is a node() call with its lines; the stages are pills at the left edge, and the arrows are a line and a filled triangle, because <marker> falls back to a picture in the PDF. The numbers are the trial's: 204 registrations, 115 confirmations, 45 bot-generated sign-ups excluded, 34 and 36 allocated, 3 and 11 lost, 31 and 25 with data at T2. For your own trial, replace the strings and counts; the layout follows the box heights. Text in an SVG drawn as an image cannot see the page's fonts, so the drawing carries Nunito Sans inline as a data URL.
#4 · Numbers that line up in the tables
// Nunito Sans sets tabular figures, so numbers right-aligned in a column line up on the
// decimal point; the (SD) or (SE) sits in a column of its own, flush left beside it.
// aligns: one letter per column, l or r; header cells over the numbers are centred.
const cell = (content, align, head) => ({ content, ...(head && { isHeader: true }),
  align: head && align !== 'left' ? 'center' : align });
function grid(rows, widths, aligns, heads, spans) { // spans: [row, col, lastRow, lastCol]
  const a = [...aligns].map((k, c) => (c && k === 'r' ? 'right' : 'left'));
  let m = { headerRowCount: heads, columnWidths: widths,
    rows: rows.map((row, r) => widths.map((_, c) => cell(row[c] ?? '', a[c], r < heads))) };
  for (const [r0, c0, r1, c1] of spans) {
    m = mergeCells(m, { start: { row: r0, col: c0 }, end: { row: r1, col: c1 } });
  }
  return m; // mergeCells marks the covered cells hiddenBy (gotcha: merged-cells-hiddenby)
}
const pair = (s) => s.split(' '); // '13.25 (5.17)' → ['13.25', '(5.17)']
const BASE = [['Depression (PHQ-9)', '13.25 (5.17)', '14.30 (6.65)'],
  ['Anxiety (GAD-7)', '19.02 (4.27)', '18.05 (5.89)'],
  ['Positive affect', '26.19 (8.37)', '25.54 (9.58)'],
  ['Negative affect', '28.74 (8.92)', '24.87 (8.13)'], ['Age, mean (SD)', '21.83 (2.24)',
    '22.58 (2.38)'], ['**Gender, n (%)**'], ['Male', '4 (7)', '7 (21)'],
  ['Female', '20 (55)', '27 (79)'], ['**Ethnicity, n (%)**'], ['Latino/Hispanic', '2 (8)', '2 (6)'],
  ['Non-Latino/Hispanic', '22 (92)', '32 (94)'], ['Caucasian', '18 (75)', '28 (82)'],
  ['Non-Caucasian', '6 (25)', '6 (18)']];
const ITT = [['PHQ-9', '13.67 (.81)', '12.07-15.27', '11.14 (0.71)', '9.74-12.32', '6.03',
  '.017', '0.44'], ['GAD-7', '16.84 (.67)', '15.52-18.56', '17.35 (0.60)', '16.16-18.13', '0.38',
  '.581', '0.14'], ['PANAS positive affect', '26.02 (1.45)', '23.17-28.86', '26.88 (1.29)',
  '24.35-29.41', '0.17', '.707', '0.02'], ['PANAS negative affect', '27.53 (1.42)',
  '24.73-30.32', '25.98 (1.24)', '23.54-28.42', '0.91', '.912', '0.344']];
const table = (id, model, span, caption, note) => ({ id, typeId: 'table', kind: 'table',
  createdAt: 0, updatedAt: 0, placement: { position: 'top', span }, caption, note,
  table: { model } });
const baseline = grid([['', 'Information control', '', 'Woebot', ''],
  ['**Scale, mean (SD)**'], ...BASE.map(([k, a, b]) => (a ? [k, ...pair(a), ...pair(b)] : [k]))],
[26, 13, 10, 13, 10], 'lrlrl', 1, [[0, 1, 0, 2], [0, 3, 0, 4], [1, 0, 1, 4], [7, 0, 7, 4],
  [10, 0, 10, 4]]);
const itt = grid([['', 'Information-only control', '', '', 'Woebot', '', '', '*F*', '*P*',
  '*d*^c^'], ['', 'T2^a^', '', '95% CI^b^', 'T2^a^', '', '95% CI^b^', '', '', ''],
...ITT.map(([k, a, ca, b, cb, ...s]) => [k, ...pair(a), ca, ...pair(b), cb, ...s])],
[30, 10, 9, 18, 10, 9, 18, 8, 8, 8], 'lrlrrlrrrr', 2, [[0, 0, 1, 0], [0, 1, 0, 3],
  [0, 4, 0, 6], [1, 1, 1, 2], [1, 4, 1, 5], [0, 7, 1, 7], [0, 8, 1, 8], [0, 9, 1, 9]]);
const resources = () => [consort,
  table('tbl-baseline', baseline, 'column', 'Demographic and clinical variables of '
    + 'participants at baseline.', 'Participants with data at T2 (N=58), as printed in the '
    + 'original Table 1.'),
  table('tbl-itt', itt, 'page', 'Results of ITT analysis of entire sample on primary outcomes '
    + 'in the study at T2.', '^a^Baseline=pooled mean (standard error). ^b^95% confidence '
    + 'interval. ^c^Cohen *d* shown for between-subjects effects using means and standard '
    + 'errors at Time 2.'),
  ...THEMES.map(({ id, file, caption, note, alt }) => ({ id, typeId: 'figure', kind: 'svg',
    createdAt: 0, updatedAt: 0, placement: { position: 'auto' }, caption, note, altText: alt,
    svg: { fileId: file, width: 845, height: Math.round(themeHeight(id) * 10) } })),
];
Nunito Sans sets its figures at one width, so a column of right-aligned means lines up on the decimal point. Each mean and its SD or SE go into two columns, the mean flush right and the bracket flush left beside it, and mergeCells builds the group headers ("Information-only control" over three columns) and the rows that span the table. Table 2 is a page-wide float; Table 1 stays in a column.
#5 · The bot's own words in nested boxes
const bubbleTitle = { fontFamily: SANS, fontSize: pt(6.6), fontWeight: 800, letterSpacing: pt(1),
  textTransform: 'uppercase', color: col('muted'), gap: mm(0.8) };
const calloutStyles = [
  abstractBox,
  { id: 'chat', backgroundEnabled: false, marginTop: pt(LEAD), marginBottom: pt(0),
    padding: { top: mm(2.5), right: mm(0), bottom: mm(0.5), left: mm(0) },
    stripe: { enabled: true, side: 'top', width: pt(2.5), color: col('accent') },
    titleStyle: { ...bubbleTitle, fontSize: pt(7.6), color: col('accent'), gap: mm(2) } },
  { id: 'bubble', background: col('tint'), borderRadius: mm(2.4), marginTop: mm(1.6),
    marginBottom: mm(0), padding: { top: mm(1.6), right: mm(3), bottom: mm(1.8), left: mm(3) },
    titleStyle: bubbleTitle,
    body: { fontFamily: SANS, fontSize: pt(8.8), lineHeight: pt(11.4), textAlign: 'left',
      firstLineIndent: pt(0), color: col('ink') } },
];
The paper quotes five messages the bot sent. The recipe gathers them in a box with an indigo top stripe, each one a nested box with rounded corners and a small label naming the feature it illustrates. Only the paper's quotations appear there; nothing is added to them.
The whole recipe
// ═══ Postext Cookbook · Nº 142 · A clinical trial report with a CONSORT diagram ══════
// https://postext.dev/en/cookbook/clinical-trial-consort-flow
// Code: MIT · Text: Fitzpatrick, Darcy & Vierhile 2017 (CC BY 4.0), abridged · Figures: code
// Fonts: Lora, Nunito Sans (SIL OFL 1.1) · Needs postext ≥ 1.34.0
import {
  buildDocumentWithFonts, renderPageToCanvas, registerCitationEngine, registerResourceImage,
  defaultResourceTypes, mergeCells, initMathEngine, inlineSvgFonts,
} from 'https://esm.sh/postext';
import { renderToPdf, decompressWoff2 } from 'https://esm.sh/postext-pdf';
import { createCiteprocEngine, STYLES, LOCALES } from 'https://esm.sh/postext-citeproc';

const LANG = 'en'; // @lang: the language of the sample document ('en' | 'es')
const RECIPE = 'clinical-trial-consort-flow';

// ─── 1 · Design ─────────────────────────────────────────────────────────────
// #region palette: a violet-tinted ink and one indigo accent; the control arm in a pale tint
const palette = { ink: '#1f1d2b', accent: '#4a3f8c', soft: '#a39cd0', tint: '#efedf7',
  rule: '#c7c2de', muted: '#5b586b', paper: '#ffffff' };
const col = (id) => ({ hex: palette[id], model: 'hex', paletteId: id });
const colorPalette = Object.entries({ ...palette, 'main-color': palette.accent })
  .map(([id, hex]) => ({ id, name: id, value: { hex, model: 'hex' } }));
// #endregion
const [SERIF, SANS] = ['Lora', 'Nunito Sans'];
const [TRIM_W, TRIM_H, TOP, BOTTOM, INNER, OUTER, GUTTER] = [210, 280, 22, 22, 18, 16, 7];
const MEASURE = TRIM_W - INNER - OUTER; // 176 mm
const LEAD = 13; // pt: 9.4 pt Lora in two columns of 84.5 mm
const CONSORT_H = 107; // mm: the height of the CONSORT drawing (its resource is × 10 px)

// #region answer: a structured abstract across both columns, and a figure drawn from numbers
// The abstract is a box whose span is 'page': the columns close above it and open again
// under it. Inside, :::columns sets Background to Results in two columns; the keywords and
// the registration line run across the box under them.
const abstractBox = { id: 'abstract', span: 'page', background: col('tint'),
  padding: { top: mm(3.5), right: mm(4.5), bottom: mm(3), left: mm(4.5) },
  marginTop: pt(0), marginBottom: pt(LEAD), columnGap: mm(7),
  titleStyle: { fontFamily: SANS, fontSize: pt(8.5), fontWeight: 800, letterSpacing: pt(1.6),
    textTransform: 'uppercase', color: col('accent'), gap: mm(2) },
  body: { fontFamily: SANS, fontSize: pt(8.4), lineHeight: pt(11.4), textAlign: 'left',
    firstLineIndent: pt(0), paragraphSpacing: true, boldColor: col('accent'),
    boldFontWeight: 800, italicColor: col('ink') } };
// The CONSORT diagram is an SVG drawn in code from the trial's numbers (see #region art),
// declared as a resource and placed by its first :ref, at the head of the next page.
const consort = { id: 'fig-consort', typeId: 'figure', kind: 'svg', createdAt: 0, updatedAt: 0,
  placement: { position: 'top', span: 'page' },
  svg: { fileId: 'consort.svg', width: 1760, height: CONSORT_H * 10 },
  caption: 'Participant flow through the trial (CONSORT diagram).',
  note: 'Redrawn from Figure 1 of the original; the Analysis row follows the Statistical '
    + 'Analysis section. The text reports 58 participants with T2 data.',
The composed script.js runs as it is: paste it into any page’s module script, or open the recipe on CodePen. Recipe folder on GitHub ↗ (opens in a new tab)
Variations
#Cite in numbered Vancouver style
Medical journals often number their citations; the BibTeX and the text stay as they are.
-  citations: { style: 'apa', link: true,
+ citations: { style: 'elsevier-vancouver', marker: 'superscript', link: true,#Add a ClinicalTrials.gov number
This trial was considered exempt from registration and says so. A registered trial gives its registry and number on the same line of the abstract box, for example **Trial registration** ClinicalTrials.gov NCT01234567, with the number of your own registration.
#A diagram without the Analysis row
When a report does not state who was analysed, end each arm at the follow-up boxes: remove the an node and its arrow, and lower CONSORT_H.
Pitfalls
Pitfall
No <marker> or filters in SVG art (raster fallback)
An SVG figure stays vector in the PDF only without <marker>, filters and masks; otherwise it falls back to a raster, and deeply nested filters can blank it in Chrome. Draw arrowheads as paths. Figures and tables as resources →
Pitfall
Maths needs await initMathEngine() before the first build
Formulas laid out before the maths engine is running are grey placeholder boxes. Import initMathEngine from https://esm.sh/postext with the other symbols and await it before the first build; a document with maths built without it prints one console warning. Since postext 1.5 MathJax ships inside the package as one module that initMathEngine fetches, so the plain import works from a CDN and ?bundle is not needed (up to 1.4 every symbol had to come from https://esm.sh/postext?bundle). Import from one URL only: two URLs load two engines. Mathematics →
Pitfall
A bare $ opens maths: write \$
A dollar sign opens inline maths, so a price such as $40 starts a formula. Write \$40. Escapes and literal characters →
Pitfall
A 'top' float goes to the page after its citation unless it may head the citing page
By default a float never goes above its own reference, so a page-wide 'top' float cited on page N opens page N+1. Set placement.citingPage: true on the resource or its type's defaultPlacement (or layout.floatsAtCitingPage for the whole book, since postext 1.25) and it heads page N instead, the text above the reference moving down under it, when it fits within layout.maxTopFraction and the citing line stays on that page. It never heads a chapter's first page or a page after a forced break: there it still opens the next page, and 'auto' or 'bottom' can take the foot of the citing page. Figure placement →
- The paper has no NCT number: the authors write that the trial was exempt from registration. The registration line says that, quoting the paper's reason, instead of inventing a number.
- A table that shares a column with a page-wide figure stops three lines short of the foot and continues on the next page. Table 1 fits whole because its rows are set at 7.5 pt with 0.45 mm padding and the CONSORT drawing is 107 mm tall.
- The paper writes χ² for its chi-square tests, and so does this edition, as inline maths:
$\chi^2_1$. None of Lora's Fontsource files has χ, not even its math file, which holds only a few Greek letters such as π and Ω; MathJax draws the χ instead, as paths in the PDF.
Credits
- Recipe
- Ignacio Ferro
- Text
- Text and data: Fitzpatrick KK, Darcy A, Vierhile M. Delivering Cognitive Behavior Therapy to Young Adults With Symptoms of Depression and Anxiety Using a Fully Automated Conversational Agent (Woebot): A Randomized Controlled Trial. JMIR Mental Health 2017;4(2):e19, doi:10.2196/mental.7785. Originally published in JMIR Mental Health (http://mental.jmir.org), 06.06.2017. Abridged; figures redrawn in code from the article's numbers; citations converted to APA author–date · © Kathleen Kara Fitzpatrick, Alison Darcy, Molly Vierhile · CC BY 4.0
- Fonts
- Lora (SIL OFL 1.1) · Nunito Sans (SIL OFL 1.1)
Edit this write-up ↗ (opens in a new tab)Recipe folder on GitHub ↗ (opens in a new tab)