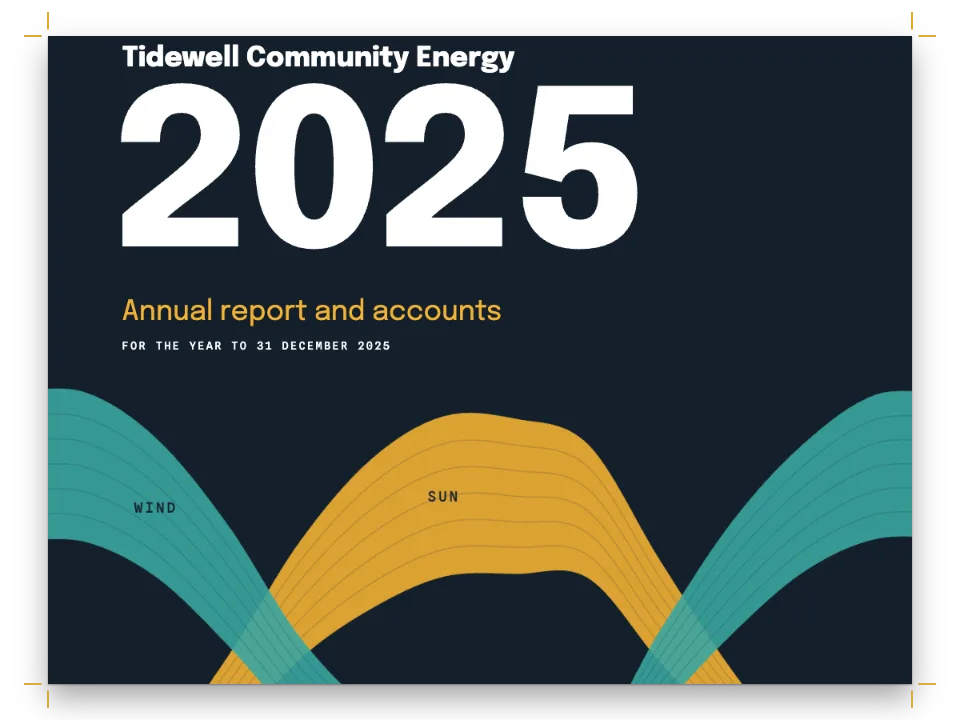
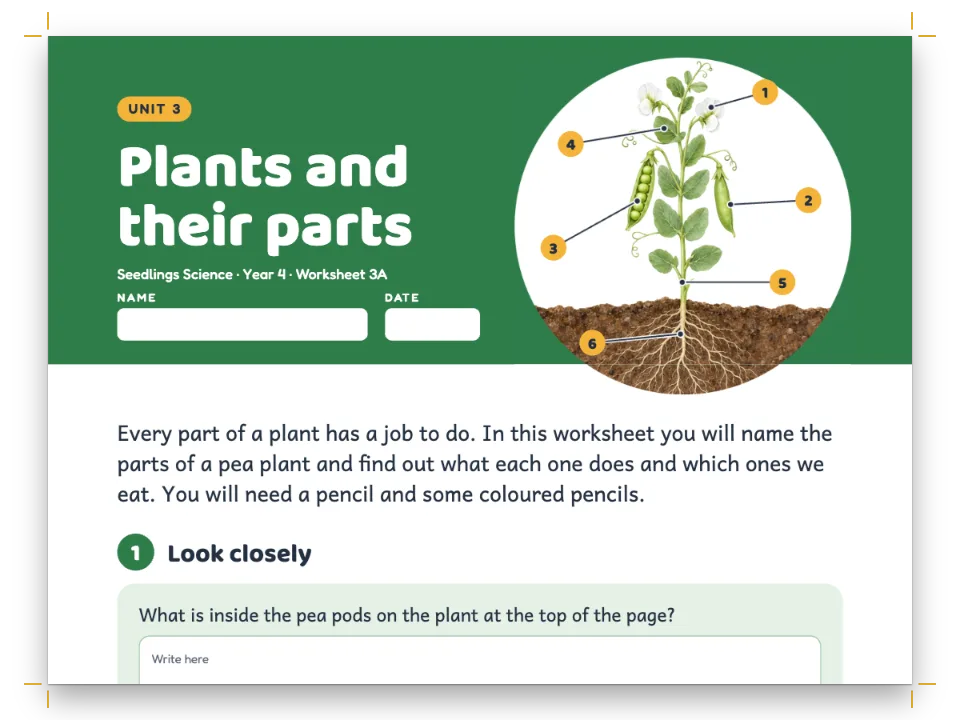
Kurz gesagt
Ein großes Poster für eine wissenschaftliche Konferenz über Straßenbäume und Sommerhitze. Es zeigt, wie Kästen mit Text und Diagrammen auf einer sehr großen Seite in Spalten angeordnet werden.
Was Sie setzen
Ein Konferenzposter für eine erfundene Studie über Straßenbäume und Gehweghitze, gesetzt auf einer Seite von 600 × 800 mm. Ein grünes Band trägt die Tagung, den Titel in Bitter in 110 pt, die Autoren mit ihren Institutionszeichen und das Zeichen der School of Geography. Unter einer zweispaltigen Zusammenfassung überquert eine Gruppe :::columns beide Textspalten und setzt sechs Panels in drei Spalten, jedes ein Kasten unter einem Streifen von 6 pt. Die mittlere Spalte beginnt mit −4,2 °C in Orange in 150 pt, dann folgen eine Heatmap der Lufttemperatur nach Block und Stunde, mit Farbfeldern erschlossen, und ein Balkendiagramm des Pflasters. Ein getönter Streifen mit Schlagwort-Chips sitzt auf dem unteren Rand. Dieselbe Datei setzt eine spanische Ausgabe, und der Pen bietet die Seite als PNG von 1.701 × 2.268 px an.
Dieses Rezept beantwortet
- Wie setze ich mitten auf der Seite einen Kasten über beide Spalten, etwa eine dreiteilige „In Zahlen“-Leiste?
- Wie setze ich zwei Spalten in einen Kasten (eine Textspalte neben einer Abbildungsspalte)?
- Wie füge ich Farbfelder als Farblegende in Text, Bildunterschriften oder Tabellenanmerkungen ein?
Die kurze Antwort
// The body text runs in two columns and the panels in three: a :::columns group in the
// text, and span="page" lays it across both body columns, the gutter apart.
//   :::columns{count=3 breaks="3,4" span="page" marginBottom="0.75em"}
//                                             ← panel 3 opens column 2, panel 4 column 3
//   :::callout{type="panel" title="Introduction"}   ← each panel is a box in the group
//   …
//   :::                                       ← closes the panel; then the other panels
//   :::                                       ← closes the columns group
// marginBottom sets the space under the group: without it the group is followed by a
// line of the summary's paragraph spacing, 38 pt.
// A box in a group takes the width of its column. Its one device is a 6 pt stripe along
// the top.
const panel = { id: 'panel', backgroundEnabled: false,
  stripe: { enabled: true, side: 'top', width: pt(6), color: col('canopy') },
  padding: { top: mm(5), right: pt(0), bottom: pt(0), left: pt(0) },
  titleStyle: { fontFamily: 'Saira Condensed', fontSize: pt(40), fontWeight: 700,
    textTransform: 'uppercase', letterSpacing: pt(4), color: col('canopy'), gap: mm(4) },
  body: { fontSize: pt(22), lineHeight: pt(30) }, // the rest follows bodyText
  marginTop: mm(18) };
const results = { ...panel, id: 'results', // the finding: the same panel, striped in heat
  stripe: { ...panel.stripe, color: col('heat') },
  titleStyle: { ...panel.titleStyle, color: col('heat') } };
Zutaten
- Funktionen
- Spalten in einem Kasten oder im TextKästen über die SeiteGestaltete AuftakteÜberschriftenattributeGestaltungselemente verankernBilder in SeitengestaltungenFarbfelderInline-ChipsSemantische FarbpaletteKästenAbbildungen genau hierAbsatzformateEndformatSeiten auf einem CanvasNummerierte BildunterschriftenQuellen- und BildnachweiseGleitende KästenGrundlinienrasterKapitelband über die ganze Breite
- Nutzt außerdem
- Literaturverzeichnisse und GlossareVerweise, die Abbildungen platzierenAbbildung und Tabelle in Ihrer SprachePapierfarbeEigene RessourcentypenAbbildungen und Tabellen als RessourcenExpliziter vertikaler Abstand
- Schrift
- Rethink Sans, Bitter, Saira Condensed (SIL OFL 1.1)
- Dateien
- The plan of the street, the heat map, the bar chart and the School of Geography's mark, drawn in code from synthetic data in the poster's palette (Ignacio Ferro, CC BY 4.0)
Zubereitung
#1 · Das Blatt mit 72 dpi setzen
const SHEET = { width: 600, height: 800, margin: 25 }; // mm: a portrait board, 25 mm all round
const GAP = 12; // mm between the two body columns and between the three panel columns
// The summary's leading is the page's baseline grid: 56 lines fill the 750 mm between the
// margins, so a box floated to the foot of the page ends on the bottom margin.
const LEAD = (((SHEET.height - 2 * SHEET.margin) / 25.4) * 72) / 56; // 37.96 pt
const page = { width: mm(SHEET.width), height: mm(SHEET.height),
  // At 72 dpi a point is a pixel: the page is 1,701 × 2,268 px. The default 300 dpi would give
  // 7,087 × 9,449 px (268 MB of canvas) for the same line breaks.
  dpi: 72, backgroundColor: col('paper'),
  margins: { top: mm(SHEET.margin), bottom: mm(SHEET.margin), left: mm(SHEET.margin),
    right: mm(SHEET.margin) } }; // one sheet, nothing to mirror
Bei den voreingestellten 300 dpi bricht das Poster jede Zeile an derselben Stelle um wie bei 72 dpi, aber seine Seite misst 7.087 × 9.449 px, also 268 MB Pixel, sobald sie gemalt ist (Vorlagen für Seitenformate). Bei 72 dpi ist ein Punkt ein Pixel. Der Betrachter malt seine Miniaturen mit renderPageToCanvas und einem scale, und renderPage liefert das PNG von 1.701 × 2.268 px, das die Online-Galerie einer Tagung verlangt (eine Seite als Bitmap rendern). Der Zeilenabstand teilt die 750 mm zwischen den Rändern in 56 Zeilen, sodass der an den Fuß der Seite gleitende Schlagwortstreifen auf dem unteren Rand endet. Bei runden 38 pt passen nur 55 Zeilen, die letzte 12,7 mm vor dem Rand; der Schlagwortstreifen passt nicht mehr unter die Panels und rückt auf eine zweite Seite.
#2 · Das Titelband aus der Überschrift zeichnen
const BAND = 158; // mm from the top edge to the foot of the green field
const type = (id, content, family, size, look, placement) => ({ kind: 'text', id, content,
  fontFamily: family, fontSize: pt(size), color: col('paper'), align: 'left',
  overflow: 'wrap', lineHeight: 1.2,
  ...look, placement });
const band = { enabled: true,
  // The field ends 133 mm under the top margin; eleven grid lines (147 mm) start the summary
  // 14 mm below it.
  minHeight: pt(11 * LEAD),
  slot: { elements: [
    { kind: 'box', id: 'field', style: { backgroundColor: col('canopy') },
      placement: { ...at('page', 'top-left'), size: { width: 'fill', height: mm(BAND) } } },
    type('meeting', '{attr.meeting}', 'Saira Condensed', 22, { fontWeight: 600,
      textTransform: 'uppercase', letterSpacing: pt(3.5), color: col('tint') },
    { ...at('page', 'top-left', SHEET.margin, 18), size: { width: mm(420) } }),
    type('title', '{titleText}', 'Bitter', 110, { fontWeight: 800, lineHeight: 1 },
      { ...at('#meeting', 'below', 0, 7), size: { width: mm(380) } }),
    type('authors', '{attr.authors}', 'Rethink Sans', 30, { fontWeight: 700 },
      { ...at('#title', 'below', 0, 7), size: { width: 'fill' } }),
    // The affiliation marks are the characters ¹ ² ³, typed in the heading's attributes.
    type('affiliations', '{attr.affiliations}', 'Rethink Sans', 21, { color: col('tint') },
      { ...at('#authors', 'below', 0, 2), size: { width: 'fill' } }),
    type('number', '{attr.poster}', 'Saira Condensed', 30, { fontWeight: 700,
      color: col('canopy'), box: { backgroundColor: col('paper'),
        padding: { top: mm(1.5), right: mm(4), bottom: mm(1), left: mm(4) } } },
    at('page', 'top-right', -SHEET.margin, 15)),
    // The School of Geography's mark, drawn in code.
    { kind: 'image', id: 'mark', resourceId: 'mark',
      placement: { ...at('page', 'top-right', -SHEET.margin, 38), size: { width: mm(92) } } },
  ] } };
Die H1 trägt Tagung, Posternummer, Autoren und Institutionen als Attribute, und ihre Gestaltung setzt sie über einen an der Seite verankerten grünen Kasten von 158 mm Höhe (Span und erweiterte Gestaltung). Der Kasten endet 133 mm unter dem oberen Rand. Ohne minHeight begänne die Zusammenfassung 0,9 mm unter dem Grün; ein minHeight von elf Rasterzeilen lässt 14 mm. Die Institutionszeichen sind die Zeichen ¹ ² ³, die einzigen hochgestellten Ziffern im Bereich Latin-1.
#3 · Die Panels in einer Gruppe über die Seite setzen
// The body text runs in two columns and the panels in three: a :::columns group in the
// text, and span="page" lays it across both body columns, the gutter apart.
//   :::columns{count=3 breaks="3,4" span="page" marginBottom="0.75em"}
//                                             ← panel 3 opens column 2, panel 4 column 3
//   :::callout{type="panel" title="Introduction"}   ← each panel is a box in the group
//   …
//   :::                                       ← closes the panel; then the other panels
//   :::                                       ← closes the columns group
// marginBottom sets the space under the group: without it the group is followed by a
// line of the summary's paragraph spacing, 38 pt.
// A box in a group takes the width of its column. Its one device is a 6 pt stripe along
// the top.
const panel = { id: 'panel', backgroundEnabled: false,
  stripe: { enabled: true, side: 'top', width: pt(6), color: col('canopy') },
  padding: { top: mm(5), right: pt(0), bottom: pt(0), left: pt(0) },
  titleStyle: { fontFamily: 'Saira Condensed', fontSize: pt(40), fontWeight: 700,
    textTransform: 'uppercase', letterSpacing: pt(4), color: col('canopy'), gap: mm(4) },
  body: { fontSize: pt(22), lineHeight: pt(30) }, // the rest follows bodyText
  marginTop: mm(18) };
const results = { ...panel, id: 'results', // the finding: the same panel, striped in heat
  stripe: { ...panel.stripe, color: col('heat') },
  titleStyle: { ...panel.titleStyle, color: col('heat') } };
Der Grundtext läuft in zwei Spalten und die Panels in drei, das Raster ist also eine Gruppe :::columns{count=3}, als Direktivenblock direkt im Text, und span="page" setzt sie über beide Textspalten, unter die Zusammenfassung, mit dem Spaltenabstand der Seite zwischen ihren Spalten (:::columns). Sich selbst überlassen folgt einer Gruppe im Text eine Zeile Absatzabstand, hier 38 pt, und der Schlagwortstreifen rückte auf eine zweite Seite; marginBottom="0.75em" am Direktivenblock tritt an die Stelle dieser Zeile (postext 1.28), und der Streifen passt an den Fuß der Seite. Jedes Panel ist ein Kasten in der Gruppe: Es nimmt sein eigenes Format, die Spaltenbreite von 175 mm und 18 mm marginTop unter dem Panel darüber (der Container :::callout). breaks="3,4" schickt das dritte Panel, „Results“, an den Kopf der mittleren Spalte und das vierte, „Conclusions“, an den Kopf der letzten. Ohne diese Angabe gleicht die Gruppe aus und schneidet beim Panel, das jedem Drittel des Stapels am nächsten liegt. Mit diesem Text fallen die Schnitte bei denselben zwei Panels; das Attribut hält sie dort, wenn sich der Text ändert.
#4 · Jede Abbildung in ihrem Panel halten
// "Figure 1", not "Figure 1.1": the poster has no chapters.
const figureType = { ...defaultResourceTypes(LANG)[0], numberingTemplate: '{n}' };
const resourceTypes = [figureType];
const figure = (id, [width, height], caption, altText) => ({ id, typeId: figureType.id,
  kind: 'svg', svg: { fileId: `${id}.svg`, width: width * 10, height: height * 10 },
  placement: { position: 'here' }, // stays in its panel, where ::resource puts it; else floats
  caption, altText, note: t({ en: 'Synthetic data, generated for this poster.',
    es: 'Datos sintéticos, generados para este póster.' }), createdAt: 0, updatedAt: 0 });
Eine mit 'here' platzierte Abbildung bleibt in dem Panel, in das ::resource sie setzt; mit der voreingestellten Platzierung verlassen die drei Zeichnungen ihre Panels, und das Poster läuft auf eine zweite Seite. numberingTemplate: '{n}' nummeriert sie mit 1, 2, 3, wo das voreingestellte {h1}.{n} unter einem Titel, der eine H1 ist, „Figure 1.1“ drucken würde (Ressourcentypen). Die Anmerkung unter jeder Bildunterschrift sagt, dass die Daten synthetisch sind.
#5 · Die Farben der Heatmap mit ihrem Schlüssel teilen
const palette = {
  ink: '#102a2c', // text: a green-black
  paper: '#f7faf7', // the sheet, and type on the band
  canopy: '#2e7d4f', // the band, the stripes and titles of five panels, the tree crowns
  tint: '#e6f2ea', // the keyword strip, the park on the plan, lines of type on the band
  rule: '#bcd2c4', // buildings on the plan, the chart's grid
  muted: '#587068', // the notes under the figures, the axis titles inside them
  // The key of Figure 2, the air against the street mean at the same hour. The heat map's
  // cells and the :swatch runs of its key read the same four entries.
  cool: '#3b82c4', // −1.5 °C or less
  mist: '#a9c9e6', // −1.5 to 0 °C
  blush: '#f2b492', // 0 to +1.5 °C
  heat: '#d9572b', // +1.5 °C or more; also −4.2 °C, the Results panel, the loggers, the sun
};
// Every colour is linked to its palette entry by id.
const col = (id) => ({ hex: palette[id], model: 'hex', paletteId: id });
const colorPalette = [ // defaults link to 'main-color': point it at the canopy green
  ...Object.entries(palette).map(([id, hex]) => ({ id, name: id, value: { hex, model: 'hex' } })),
  { id: 'main-color', name: 'canopy (defaults)', value: { hex: palette.canopy, model: 'hex' } },
];
Die Zellen der Heatmap und die vier Läufe :swatch{color="…"} ihres Schlüssels nennen dieselben Paletteneinträge, sodass ein neuer Wert für cool Karte und Schlüssel zugleich umfärbt (Inline-Formatierung). Der Schlüssel ist eine zweite Gruppe :::columns, zwei Einträge pro Spalte, im Panel „Results“.
#6 · Die Leitzahl in einem Absatzformat setzen
const paragraphStyles = [
  // Paragraph styles apply inside boxes. The figure is written **bold**: that sets it in
  // Bitter 700 and in the style's boldColor.
  // containerSpacing 'add': the group ends on the style's own space, with no line of
  // paragraph spacing under it. −4.2 °C sits on the line that explains it, and a :::space
  // sets the gap under the references.
  { id: 'stat', fontFamily: 'Bitter', fontSize: pt(150), lineHeight: pt(130),
    boldColor: col('heat'), containerSpacing: 'add' },
  { id: 'refs', fontSize: pt(19), lineHeight: pt(26), hangingIndent: mm(9), spaceBetween: pt(8),
    containerSpacing: 'add' },
  { id: 'key', fontSize: pt(19), lineHeight: pt(28) }, // the key of Figure 2
];
const chipStyles = [{ id: 'keyword', background: col('paper'), borderColor: col('canopy'),
  borderWidth: pt(1.5), borderRadius: em(1), paddingX: em(0.55), paddingY: em(0.14),
  color: col('canopy'), bold: true, gap: em(0.35) }];
const strip = { id: 'strip', background: col('tint'), // one device: a tint
  padding: { top: mm(4), right: mm(8), bottom: mm(4), left: mm(8) }, columnGap: mm(GAP),
  body: { fontSize: pt(18), lineHeight: pt(24) } };
Absatzformate gelten auch in Kästen, −4,2 °C ist also ein Block :::paragraphs{style="stat"} in Bitter in 150 pt im Panel „Results“ (Absatzformate). Die Zahl ist fett geschrieben, sie erscheint also in Bitter 700 und in der boldColor des Formats, dem Orange des Panels. Ein zweites Format gibt den Literaturangaben einen hängenden Einzug von 9 mm. Der Schlagwortstreifen ist ein getönter Kasten mit placement="bottom", der unter dem Raster an den Fuß der Seite gleitet.
Das ganze Rezept
// ═══ Postext Cookbook · Nº 059 · Research poster on one big page ══════════════════ // https://postext.dev/en/cookbook/research-poster // Code: MIT · Text and data: original, synthetic (CC BY 4.0) · Figures: generated in code // Fonts: Rethink Sans, Bitter, Saira Condensed (SIL OFL 1.1) · Needs postext ≥ 1.28.0 import { buildDocumentWithFonts, renderPage, renderPageToCanvas, registerResourceImage, defaultResourceTypes, inlineSvgFonts, } from 'https://esm.sh/postext'; const LANG = 'en'; // @lang: the language of the sample document ('en' | 'es') const RECIPE = 'research-poster'; // ─── 1 · Design ───────────────────────────────────────────────────────────── // #region palette: six colours for the poster, four for the heat map's key const palette = { ink: '#102a2c', // text: a green-black paper: '#f7faf7', // the sheet, and type on the band canopy: '#2e7d4f', // the band, the stripes and titles of five panels, the tree crowns tint: '#e6f2ea', // the keyword strip, the park on the plan, lines of type on the band rule: '#bcd2c4', // buildings on the plan, the chart's grid muted: '#587068', // the notes under the figures, the axis titles inside them // The key of Figure 2, the air against the street mean at the same hour. The heat map's // cells and the :swatch runs of its key read the same four entries. cool: '#3b82c4', // −1.5 °C or less mist: '#a9c9e6', // −1.5 to 0 °C blush: '#f2b492', // 0 to +1.5 °C heat: '#d9572b', // +1.5 °C or more; also −4.2 °C, the Results panel, the loggers, the sun }; // Every colour is linked to its palette entry by id. const col = (id) => ({ hex: palette[id], model: 'hex', paletteId: id }); const colorPalette = [ // defaults link to 'main-color': point it at the canopy green ...Object.entries(palette).map(([id, hex]) => ({ id, name: id, value: { hex, model: 'hex' } })), { id: 'main-color', name: 'canopy (defaults)', value: { hex: palette.canopy, model: 'hex' } }, ]; // #endregion // #region sheet: one 600 × 800 mm page, laid out at 72 dpi const SHEET = { width: 600, height: 800, margin: 25 }; // mm: a portrait board, 25 mm all round const GAP = 12; // mm between the two body columns and between the three panel columns // The summary's leading is the page's baseline grid: 56 lines fill the 750 mm between the // margins, so a box floated to the foot of the page ends on the bottom margin. const LEAD = (((SHEET.height - 2 * SHEET.margin) / 25.4) * 72) / 56; // 37.96 pt const page = { width: mm(SHEET.width), height: mm(SHEET.height), // At 72 dpi a point is a pixel: the page is 1,701 × 2,268 px. The default 300 dpi would give // 7,087 × 9,449 px (268 MB of canvas) for the same line breaks. dpi: 72, backgroundColor: col('paper'), margins: { top: mm(SHEET.margin), bottom: mm(SHEET.margin), left: mm(SHEET.margin), right: mm(SHEET.margin) } }; // one sheet, nothing to mirror // #endregion const at = (to, edge, x = 0, y = 0) => ({ anchor: { to, edge }, offset: { x: mm(x), y: mm(y) } }); // #region band: the title band is the H1's design, filled from its attributes const BAND = 158; // mm from the top edge to the foot of the green field const type = (id, content, family, size, look, placement) => ({ kind: 'text', id, content, fontFamily: family, fontSize: pt(size), color: col('paper'), align: 'left', overflow: 'wrap', lineHeight: 1.2, ...look, placement }); const band = { enabled: true, // The field ends 133 mm under the top margin; eleven grid lines (147 mm) start the summary // 14 mm below it. minHeight: pt(11 * LEAD), slot: { elements: [ { kind: 'box', id: 'field', style: { backgroundColor: col('canopy') }, placement: { ...at('page', 'top-left'), size: { width: 'fill', height: mm(BAND) } } }, type('meeting', '{attr.meeting}', 'Saira Condensed', 22, { fontWeight: 600, textTransform: 'uppercase', letterSpacing: pt(3.5), color: col('tint') }, { ...at('page', 'top-left', SHEET.margin, 18), size: { width: mm(420) } }), type('title', '{titleText}', 'Bitter', 110, { fontWeight: 800, lineHeight: 1 }, { ...at('#meeting', 'below', 0, 7), size: { width: mm(380) } }), type('authors', '{attr.authors}', 'Rethink Sans', 30, { fontWeight: 700 }, { ...at('#title', 'below', 0, 7), size: { width: 'fill' } }), // The affiliation marks are the characters ¹ ² ³, typed in the heading's attributes. type('affiliations', '{attr.affiliations}', 'Rethink Sans', 21, { color: col('tint') }, { ...at('#authors', 'below', 0, 2), size: { width: 'fill' } }), type('number', '{attr.poster}', 'Saira Condensed', 30, { fontWeight: 700, color: col('canopy'), box: { backgroundColor: col('paper'), padding: { top: mm(1.5), right: mm(4), bottom: mm(1), left: mm(4) } } }, at('page', 'top-right', -SHEET.margin, 15)), // The School of Geography's mark, drawn in code. { kind: 'image', id: 'mark', resourceId: 'mark', placement: { ...at('page', 'top-right', -SHEET.margin, 38), size: { width: mm(92) } } }, ] } }; // #endregion // #region answer: three columns of panels in a group across the page // The body text runs in two columns and the panels in three: a :::columns group in the // text, and span="page" lays it across both body columns, the gutter apart. // :::columns{count=3 breaks="3,4" span="page" marginBottom="0.75em"} // ← panel 3 opens column 2, panel 4 column 3 // :::callout{type="panel" title="Introduction"} ← each panel is a box in the group // … // ::: ← closes the panel; then the other panels // ::: ← closes the columns group // marginBottom sets the space under the group: without it the group is followed by a // line of the summary's paragraph spacing, 38 pt. // A box in a group takes the width of its column. Its one device is a 6 pt stripe along // the top. const panel = { id: 'panel', backgroundEnabled: false, stripe: { enabled: true, side: 'top', width: pt(6), color: col('canopy') }, padding: { top: mm(5), right: pt(0), bottom: pt(0), left: pt(0) }, titleStyle: { fontFamily: 'Saira Condensed', fontSize: pt(40), fontWeight: 700, textTransform: 'uppercase', letterSpacing: pt(4), color: col('canopy'), gap: mm(4) }, body: { fontSize: pt(22), lineHeight: pt(30) }, // the rest follows bodyText marginTop: mm(18) }; const results = { ...panel, id: 'results', // the finding: the same panel, striped in heat stripe: { ...panel.stripe, color: col('heat') }, titleStyle: { ...panel.titleStyle, color: col('heat') } }; // #endregion // #region type: paragraph styles for the figure, the references and the key; the foot strip const paragraphStyles = [ // Paragraph styles apply inside boxes. The figure is written **bold**: that sets it in // Bitter 700 and in the style's boldColor. // containerSpacing 'add': the group ends on the style's own space, with no line of // paragraph spacing under it. −4.2 °C sits on the line that explains it, and a :::space // sets the gap under the references. { id: 'stat', fontFamily: 'Bitter', fontSize: pt(150), lineHeight: pt(130), boldColor: col('heat'), containerSpacing: 'add' }, { id: 'refs', fontSize: pt(19), lineHeight: pt(26), hangingIndent: mm(9), spaceBetween: pt(8), containerSpacing: 'add' }, { id: 'key', fontSize: pt(19), lineHeight: pt(28) }, // the key of Figure 2 ]; const chipStyles = [{ id: 'keyword', background: col('paper'), borderColor: col('canopy'), borderWidth: pt(1.5), borderRadius: em(1), paddingX: em(0.55), paddingY: em(0.14), color: col('canopy'), bold: true, gap: em(0.35) }]; const strip = { id: 'strip', background: col('tint'), // one device: a tint padding: { top: mm(4), right: mm(8), bottom: mm(4), left: mm(8) }, columnGap: mm(GAP), body: { fontSize: pt(18), lineHeight: pt(24) } }; // #endregion const config = () => ({ colorPalette, page, locale: t({ en: 'en-us', es: 'es' }), // the poster's language, and its bundle's layout: { layoutType: 'double', gutterWidth: mm(GAP) }, // The summary's type; the boxes take the family, the rag and the paragraph spacing from it. bodyText: { fontFamily: 'Rethink Sans', fontSize: pt(28), lineHeight: pt(LEAD), color: col('ink'), textAlign: 'left', firstLineIndent: pt(0), paragraphSpacing: true, // Bold, the :ref labels and the italics of the references in ink: left to their defaults // they follow main-color, the canopy green. boldColor: col('ink'), italicColor: col('ink') }, // The band draws the title, but the H1's own text is still measured: in Bitter, a face // already loaded, instead of the default Open Sans 700. headings: { fontFamily: 'Bitter', levels: [ // parity 'any': a second poster in the file would start the next page, either side. { level: 1, span: 'page', breakBefore: { enabled: true, parity: 'any' }, marginBottom: pt(0), advancedDesign: band }] }, calloutStyles: [panel, results, strip], paragraphStyles, chipStyles, resourceTypes, captionStyle: { fontSize: pt(19), labelColor: col('canopy'), gap: mm(3), note: { fontSize: pt(17), color: col('muted') } }, header: { elements: [] }, footer: { elements: [] }, // a poster has no running heads }); // ─── 2 · Content ──────────────────────────────────────────────────────────── // #region figures: three drawings set inside their panels, numbered 1, 2, 3 // "Figure 1", not "Figure 1.1": the poster has no chapters. const figureType = { ...defaultResourceTypes(LANG)[0], numberingTemplate: '{n}' }; const resourceTypes = [figureType]; const figure = (id, [width, height], caption, altText) => ({ id, typeId: figureType.id, kind: 'svg', svg: { fileId: `${id}.svg`, width: width * 10, height: height * 10 }, placement: { position: 'here' }, // stays in its panel, where ::resource puts it; else floats caption, altText, note: t({ en: 'Synthetic data, generated for this poster.', es: 'Datos sintéticos, generados para este póster.' }), createdAt: 0, updatedAt: 0 }); // #endregion const markdown = String.raw`---Markdown-Beispiel · 91 Zeilen · content.en.md
title: "Street trees and sidewalk heat" author: "Amara Osei, Tomás Lindqvist, Hannah Kiel" --- # Street trees and sidewalk heat {meeting="Fourth Meeting on Streets and Climate · Wrenfield, 14–16 October 2026" poster="P-47" authors="Amara Osei¹ · Tomás Lindqvist² · Hannah Kiel¹,³" affiliations="¹ School of Geography, University of Wrenfield ² Street Trees Team, Wrenfield City Council ³ Lowmoor Institute for Urban Climate"} **Summary.** We logged the air at head height on the sixteen blocks of Ashby Road, and photographed both sidewalks with a thermal camera, on the fourteen afternoons of 2025 above 30 °C. From 13:00 to 17:00 the air on the blocks under 70 % canopy or more was 4.2 °C cooler than on the near-treeless blocks of the Parade, and the paving 15 °C cooler. The council will use the result to choose which of its 212 empty tree pits to plant first. :::columns{count=3 breaks="3,4" span="page" marginBottom="0.75em"} :::callout{type="panel" title="Introduction"} By mid-afternoon in July a sunlit concrete sidewalk can pass 50 °C, and the air above it warms with it. Tree crowns stop the sun before it reaches the paving [1, 2]. Most studies compare a park with the streets around it [3]. Ashby Road runs from bare paving to crowns that meet over the road, so each block can be compared with its neighbours on the same afternoon. **Question.** How much cooler is a block for each step of canopy cover, and at which hours? ::: :::callout{type="panel" title="Methods"} Ashby Road (:ref{id="plan"}) runs 800 m from Ashby Park to the bus station, in sixteen blocks of 50 m. Planes from 1908 line the park end and limes from the 1950s shade blocks 13 to 15; the Parade, a row of shops, has almost no trees. ::resource{id="plan"} - **Air.** A logger per block, 1.5 m up a lamp post, read every 5 minutes. - **Paving.** A thermal camera walked both sidewalks at 15:00. - **Canopy.** The share of sidewalk under crowns, traced on aerial photographs. Air is given against the street mean at the same hour, which takes out the day's weather. ::: :::callout{type="results" title="Results"} :::paragraphs{style="stat"} **−4.2 °C** ::: **Air at head height from 13:00 to 17:00, under 70 % canopy or more, against the blocks under 10 %.** The planes and the limes keep their blocks cool all afternoon; the Parade stays warm (:ref{id="heat"}). :::columns{count=2 breaks="3"} :::paragraphs{style="key"} :swatch{color="cool"} −1.5 °C or less :swatch{color="mist"} −1.5 to 0 °C :swatch{color="blush"} 0 to +1.5 °C :swatch{color="heat"} +1.5 °C or more ::: ::: ::resource{id="heat"} At 15:00 the paving (:ref{id="bars"}) was 48.4 °C on the Parade and 33.4 °C under the densest crowns. ::resource{id="bars"} ::: :::callout{type="panel" title="Conclusions"} Every 10 % of canopy cover took 2.1 °C off the paving at 15:00, and 0.6 °C off the air between 13:00 and 17:00. The effect is largest in the afternoon, when people walk home. Before 09:00 and after 19:00 the difference stays under 1.5 °C, and at 20:00 the shade is 0.4 °C warmer. The Parade is the hottest 200 m of the street. If the relation holds, the paving there would drop from 48.4 °C to about 39 °C at 15:00 once new crowns cover half the sidewalk. ::: :::callout{type="panel" title="Planting plan"} The council plants the hottest blocks first. We will repeat the survey in the summer of 2028. 1. **Blocks 7–10**, the Parade: 38 trees in 2026. 2. **Block 16**, the bus station: 9 trees in 2027. 3. **Blocks 11–12**: 21 trees in 2027. 4. **Blocks 5–6**: 12 trees in 2028. ::: :::callout{type="panel" title="References"} :::paragraphs{style="refs"} [1] Oke, T.R. (1982). The energetic basis of the urban heat island. *Quarterly Journal of the Royal Meteorological Society*, 108, 1–24. [2] Armson, D., Stringer, P. and Ennos, A.R. (2012). The effect of tree shade and grass on surface and globe temperatures in an urban area. *Urban Forestry & Urban Greening*, 11, 245–255. [3] Bowler, D.E., Buyung-Ali, L., Knight, T.M. and Pullin, A.S. (2010). Urban greening to cool towns and cities: a systematic review of the empirical evidence. *Landscape and Urban Planning*, 97, 147–155. ::: :::space{lines=0.75} We thank the Wrenfield street-lighting depot for the lamp posts, and Inês Barros for walking the thermal survey fourteen times. ::: ::: :::callout{type="strip" span="page" placement="bottom"} :::columns{count=2 breaks="2"} **Keywords** :chip[street trees]{style="keyword"} :chip[urban heat]{style="keyword"} :chip[canopy cover]{style="keyword"} :chip[thermal imaging]{style="keyword"} The street, the council, the authors and the data are invented for the Postext Cookbook. Set in Rethink Sans, Bitter and Saira Condensed (SIL OFL). Text and figures CC BY 4.0. ::: :::`; // content.<lang>.md, inlined by the Cookbook // #region art: the synthetic survey, the plan, the heat map, the bars and the mark function mulberry32(seed) { // a seeded PRNG: the same survey on every run return () => { seed = (seed + 0x6d2b79f5) | 0; let r = Math.imul(seed ^ (seed >>> 15), 1 | seed); r = (r + Math.imul(r ^ (r >>> 7), 61 | r)) ^ r; return ((r ^ (r >>> 14)) >>> 0) / 4294967296; }; } // Sixteen 50 m blocks, west to east: the park's planes, houses, the Parade, new planting, // old limes and the bus station. Canopy is the share of sidewalk under crowns, in %. const CANOPY = [84, 78, 72, 66, 45, 31, 4, 0, 6, 9, 18, 27, 58, 74, 71, 12]; const HOURS = [8, 9, 10, 11, 12, 13, 14, 15, 16, 17, 18, 19, 20]; // How much of the shade shows in the air at each hour: most at 14:00–15:00, reversed by 20:00. const SUN = [0.3, 0.4, 0.55, 0.7, 0.85, 0.95, 1, 1, 0.95, 0.8, 0.55, 0.25, -0.1]; const SURVEY = (() => { // air: °C against the street mean at the hour; surface: °C at 15:00 const rand = mulberry32(25); // Six uniforms summed and scaled: close enough to a normal draw with a mean of 0 and an SD of 1. const noise = () => [...Array(6)].reduce((sum) => sum + rand(), -3) / Math.sqrt(0.5); const mean = CANOPY.reduce((a, b) => a + b) / CANOPY.length; return CANOPY.map((c) => ({ canopy: c, air: SUN.map((w) => (w * 6.2 * (mean - c)) / 100 + 0.22 * noise()), surface: 49.2 - 0.205 * c + 0.7 * noise() })); })(); const CLASSES = [[0, 10], [10, 30], [30, 50], [50, 70], [70, 101]]; // canopy classes, % const avg = (values) => values.reduce((a, b) => a + b, 0) / values.length; const surfaceOf = ([lo, hi]) => avg(SURVEY.filter((b) => b.canopy >= lo && b.canopy < hi) .map((b) => b.surface)); const classOf = (v) => (v <= -1.5 ? 'cool' : v < 0 ? 'mist' : v < 1.5 ? 'blush' : 'heat'); const f = (v) => +v.toFixed(2); const X0 = 12; // mm: the left gutter of the plan and the heat map const CELL = (175 - X0) / CANOPY.length; // mm per block: the plan and Figure 2 share columns const cx = (i) => f(X0 + (i + 0.5) * CELL); const label = (x, y, text, size, fill = palette.ink, anchor = 'middle', extra = '') => `<text x="${f(x)}" y="${f(y)}" font-size="${size}" text-anchor="${anchor}" fill="${fill}"` + `${extra}>${text}</text>`; // A drawing with labels names their face on its root element: loadSvg embeds it for the // canvas (inlineSvgFonts). const LABELS = 'font-family="Saira Condensed" font-weight="600"'; const svg = (w, h, body, face = '') => `<svg xmlns="http://www.w3.org/2000/svg" ` + `width="${w * 10}" height="${h * 10}" viewBox="0 0 ${w} ${h}" ${face}>${body}</svg>`; const channel = (hex, i) => parseInt(hex.slice(i, i + 2), 16); const mix = (a, b, k) => `#${[1, 3, 5].map((i) => Math.round(channel(a, i) * (1 - k) + channel(b, i) * k).toString(16).padStart(2, '0')).join('')}`; // a towards b by k const FIG = { plan: [175, 62], heat: [175, 126], bars: [175, 75] }; // mm, at column width const LABEL = 5.4; // mm: figure labels, about 15 pt function planSvg() { // Figure 1: a schematic plan, west on the left const rand = mulberry32(1908); // seeded with the year the planes were planted const [W, H] = FIG.plan; const [NB, NS, ROAD, SS, SB] = [[11, 22], [22, 25], [25, 34], [34, 37], [37, 48]]; // y bands const SIDE = [4, 6, 10, 13]; // side streets east of these blocks (block index from 0) let out = `<rect x="${X0}" y="${ROAD[0]}" width="${W - X0}" height="${ROAD[1] - ROAD[0]}" ` + `fill="${mix(palette.paper, palette.ink, 0.16)}"/>`; for (let x = X0 + 2; x < W - 2; x += 6) { // the centre line out += `<path d="M${f(x)} 29.5h3" stroke="${palette.paper}" stroke-width="0.4"/>`; } CANOPY.forEach((c, i) => { // the frontages: houses, the park, the shops const x = X0 + i * CELL; const w = SIDE.includes(i) ? CELL - 3.2 : CELL; if (i < 3) { out += `<rect x="${f(x)}" y="${NB[0] - 2}" width="${f(w)}" height="${NB[1] - NB[0] + 2}" ` + `fill="${palette.tint}"/>`; } else { const fill = i >= 6 && i <= 9 ? mix(palette.rule, palette.ink, 0.3) : palette.rule; for (const [y0, y1] of [NB, SB]) { const cut = rand() * 0.3 + 0.35; out += `<rect x="${f(x + 0.4)}" y="${y0}" width="${f(w * cut - 0.8)}" height="${y1 - y0}"` + ` fill="${fill}"/><rect x="${f(x + w * cut + 0.4)}" y="${y0}" ` + `width="${f(w * (1 - cut) - 0.8)}" height="${y1 - y0}" fill="${fill}"/>`; } } }); out += `<rect x="${f(X0)}" y="${SB[0]}" width="${f(3 * CELL - 0.8)}" height="${SB[1] - SB[0]}" ` + `fill="${palette.rule}"/>`; // houses face the park across the road CANOPY.forEach((c, i) => { // crowns along both sidewalks, as many as the canopy share const n = Math.round((c / 100) * 3.6); // Under 14 % the share rounds to no crown: such a block gets one tree on the south side. const rows = n > 0 ? [[NS, n], [SS, n]] : c > 0 ? [[SS, 1]] : []; for (const [[y0, y1], count] of rows) { for (let k = 0; k < count; k++) { const x = X0 + i * CELL + ((k + 0.5) / count) * CELL + (rand() - 0.5) * 1.2; const r = 2 + (c / 100) * 1.3 + rand() * 0.5; // the old planes have the widest crowns out += `<circle cx="${f(x)}" cy="${f((y0 + y1) / 2)}" r="${f(r)}" fill="${palette.canopy}"` + ` fill-opacity="0.85" stroke="${palette.paper}" stroke-width="0.3"/>`; } } if (i < 3) { // the park's own trees for (let k = 0; k < 4; k++) { out += `<circle cx="${f(X0 + i * CELL + 2 + rand() * (CELL - 4))}" ` + `cy="${f(NB[0] + 1 + rand() * 7)}" r="${f(1.8 + rand())}" fill="${palette.canopy}" ` + 'fill-opacity="0.55"/>'; } } }); CANOPY.forEach((c, i) => { // the loggers, on the north kerb, one per block out += `<circle cx="${cx(i)}" cy="${NS[1]}" r="1.4" fill="${palette.heat}" ` + `stroke="${palette.ink}" stroke-width="0.35"/>` + label(cx(i), 55, i + 1, LABEL); }); const names = t({ en: ['ASHBY PARK', 'THE PARADE', 'BUS STATION'], es: ['PARQUE DE LA ALAMEDA', 'TRAMO COMERCIAL', 'ESTACIÓN DE AUTOBUSES'] }); const track = ' letter-spacing="0.4"'; out += label(X0, 6.5, names[0], LABEL - 0.6, palette.canopy, 'start', track) + label(X0 + 8 * CELL, 6.5, names[1], LABEL - 0.6, palette.ink, 'middle', track) + label(W, 6.5, names[2], LABEL - 0.6, palette.ink, 'end', track); // The north arrow in the gutter: a line and a triangle. out += `<path d="M5 27V18" stroke="${palette.ink}" stroke-width="0.7"/>` + `<path d="M5 13l2.6 5.4h-5.2z" fill="${palette.ink}"/>` + label(5, 34, 'N', LABEL); const bar = 2 * CELL; // 100 m: two blocks out += `<path d="M${X0} 60.6h${f(bar)}" stroke="${palette.ink}" stroke-width="0.9"/>` + label(X0 + bar + 2, 61.8, '100 m', LABEL - 0.6, palette.ink, 'start'); return svg(W, H, out, LABELS); } function heatSvg() { // Figure 2: canopy bars over an hour × block heat map const [W, H] = FIG.heat; const [BASE, TOP, ROW] = [27, 30, 6.2]; // mm: foot of the bars, top of the grid, row height let out = ''; SURVEY.forEach((b, i) => { const h = (b.canopy / 100) * 18; out += `<rect x="${f(X0 + i * CELL + 1.6)}" y="${f(BASE - h)}" width="${f(CELL - 3.2)}" ` + `height="${f(h)}" fill="${palette.canopy}"/>` + label(cx(i), f(BASE - h - 1.6), b.canopy, LABEL - 0.8); b.air.forEach((v, r) => { out += `<rect x="${f(X0 + i * CELL + 0.3)}" y="${f(TOP + r * ROW + 0.3)}" ` + `width="${f(CELL - 0.6)}" height="${f(ROW - 0.6)}" fill="${palette[classOf(v)]}"/>`; }); out += label(cx(i), TOP + HOURS.length * ROW + 6.5, i + 1, LABEL); }); out += `<path d="M${X0} ${BASE + 0.2}H${W}" stroke="${palette.ink}" stroke-width="0.4"/>` + label(X0 - 1.5, BASE - 7, '%', LABEL, palette.ink, 'end'); // level with the bars HOURS.forEach((hour, r) => { if (hour % 2 === 0) { out += label(X0 - 1.5, TOP + r * ROW + 5, String(hour).padStart(2, '0'), LABEL, palette.ink, 'end'); } }); const track = ' letter-spacing="0.4"'; const [west, east, hour] = t({ en: ['WEST', 'EAST', 'HOUR'], es: ['OESTE', 'ESTE', 'HORA'] }); const mid = f(TOP + (HOURS.length * ROW) / 2); // the hour axis's title runs up the gutter out += label(X0, H - 0.5, west, LABEL - 1, palette.muted, 'start', track) + label(W, H - 0.5, east, LABEL - 1, palette.muted, 'end', track) + label(0, 0, hour, LABEL - 1, palette.muted, 'middle', `${track} transform="translate(3.4 ${mid}) rotate(-90)"`); return svg(W, H, out, LABELS); } function barsSvg() { // Figure 3: how much cooler the paving was, by canopy class const [W, H] = FIG.bars; const [LEFT, ROW, SCALE] = [40, 13, 7.6]; // SCALE: mm per °C const names = t({ en: ['under 10 %', '10–30 %', '30–50 %', '50–70 %', '70 % or more'], es: ['menos del 10 %', '10–30 %', '30–50 %', '50–70 %', '70 % o más'] }); const base = surfaceOf(CLASSES[0]); // the paving under 10 % canopy: the zero of the scale const num = (v) => t({ en: v.toFixed(1), es: v.toFixed(1).replace('.', ',') }); const foot = 5 * ROW + 2; let out = ''; for (const step of [5, 10, 15]) { out += `<path d="M${LEFT + step * SCALE} 1V${foot}" stroke="${palette.rule}" ` + 'stroke-width="0.35"/>' + label(LEFT + step * SCALE, foot + 6.5, step, LABEL); } CLASSES.forEach((cls, i) => { const cooler = base - surfaceOf(cls); const y = 1 + i * ROW; const fill = mix(palette.tint, palette.canopy, 0.3 + 0.7 * (i / 4)); out += label(LEFT - 3, y + 8.3, names[i], LABEL, palette.ink, 'end'); if (i === 0) out += label(LEFT + 2, y + 8.3, `${num(base)} °C`, LABEL, palette.muted, 'start'); else { out += `<rect x="${LEFT}" y="${y + 1.2}" width="${f(cooler * SCALE)}" height="${ROW - 2.4}" ` + `fill="${fill}"/>` + label(LEFT + cooler * SCALE + 2, y + 8.3, num(cooler), LABEL, palette.ink, 'start'); } }); const axis = t({ en: '°C cooler than the blocks under 10 %', es: '°C por debajo de las manzanas de menos del 10 %' }); out += `<path d="M${LEFT} 0V${foot + 1}" stroke="${palette.ink}" stroke-width="0.6"/>` + label(LEFT, foot + 6.5, '0', LABEL) + label(LEFT + 7.5 * SCALE, foot + 14, axis, LABEL, palette.muted, 'middle'); return svg(W, H, out, LABELS); } function markSvg() { // the School of Geography's mark: a crown shading a street, in a ring const shade = mix(palette.canopy, palette.ink, 0.45); return svg(10, 10, '<g transform="scale(0.1)">' + `<circle cx="50" cy="50" r="46" fill="none" stroke="${palette.paper}" stroke-width="3.2"/>` + `<circle cx="70" cy="25" r="8" fill="${palette.heat}"/>` // the sun, behind the crown + `<ellipse cx="43" cy="71" rx="23" ry="4.5" fill="${shade}"/>` // its shade on the paving + `<rect x="47" y="48" width="6" height="23" fill="${palette.paper}"/>` + `<circle cx="50" cy="37" r="17" fill="${palette.paper}"/>` + `<circle cx="35" cy="46" r="11" fill="${palette.paper}"/>` + `<circle cx="65" cy="46" r="11" fill="${palette.paper}"/>` + `<path d="M17 71H83" stroke="${palette.paper}" stroke-width="3.2"/></g>`, ''); } // #endregion const resources = [ figure('plan', FIG.plan, t({ en: 'Ashby Road, schematic plan: crowns from the canopy survey and the 16 loggers ' + '(orange). Widths across the street are not to scale.', es: 'La avenida en plano esquemático: las copas del inventario de arbolado y los 16 ' + 'registradores (naranja). Los anchos transversales no están a escala.' }), t({ en: 'Plan of a straight street in 16 numbered blocks, with a park at the west end, tree ' + 'crowns along both sidewalks and one tree or none on each of blocks 7 to 10.', es: 'Plano de una calle recta en 16 manzanas numeradas, con un parque en el extremo oeste, ' + 'copas en las dos aceras y un árbol o ninguno en cada una de las manzanas 7 a 10.' })), figure('heat', FIG.heat, t({ en: 'Canopy cover per block (bars, %) and the air at head height against the street mean ' + 'at the same hour, from 08:00 to 20:00; mean of 14 afternoons.', es: 'Copa por manzana (barras, %) y aire a la altura de la cabeza respecto a la media de ' + 'la calle a esa hora, de 08:00 a 20:00; media de 14 tardes.' }), t({ en: 'Bar chart of canopy cover for 16 blocks above a grid of coloured cells, hours down ' + 'and blocks across: blue under the tree-lined blocks in the afternoon, orange along ' + 'blocks 7 to 10.', es: 'Barras de cobertura de copa de 16 manzanas sobre una cuadrícula de celdas de color, ' + 'horas hacia abajo y manzanas en horizontal: azul bajo las manzanas arboladas por la ' + 'tarde, naranja en las manzanas 7 a 10.' })), figure('bars', FIG.bars, t({ en: 'The paving at 15:00 by canopy class, as the difference from the blocks under 10 %.', es: 'El pavimento a las 15:00 por clase de copa, como diferencia con las manzanas de ' + 'menos del 10 %.' }), t({ en: 'Horizontal bars that grow with the canopy class, from 2.7 to 15.0 °C cooler.', es: 'Barras horizontales que crecen con la clase de copa, de 2,7 a 15,0 °C menos.' })), // Not cited in the text: only the band's design draws it. { id: 'mark', typeId: figureType.id, kind: 'svg', svg: { fileId: 'mark.svg', width: 100, height: 100 }, altText: t({ en: 'The mark of the School of Geography', es: 'La marca del Departamento de Geografía' }), createdAt: 0, updatedAt: 0 }, ]; // ─── 3 · Fonts ────────────────────────────────────────────────────────────── const FONTS = { // text, display and label faces, loaded before the build 'Rethink Sans': ['400', '400i', '700'], Bitter: ['400', '700', '800'], // 400: the stat style's base face, which the build measures 'Saira Condensed': ['600', '700'] }; // ─── 4 · Build & show ─────────────────────────────────────────────────────── await Promise.all([loadSvg('plan.svg', planSvg()), loadSvg('heat.svg', heatSvg()), loadSvg('bars.svg', barsSvg()), loadSvg('mark.svg', markSvg())]); const doc = await buildDocumentWithFonts({ markdown, resources }, config(), kitFonts(FONTS)); showPages(doc, { title: t({ en: 'Research poster', es: 'Póster científico' }) }); // The e-poster: renderPage paints the page at its own size, 1,701 × 2,268 px at 72 dpi. const png = Object.assign(document.createElement('a'), { download: `${RECIPE}.png`, textContent: t({ en: 'E-poster PNG', es: 'PNG del póster digital' }) }); renderPage(doc.pages[0], doc).toBlob((blob) => { png.href = URL.createObjectURL(blob); }); document.getElementById('pt-actions').append(png);Kit · core, fonts, viewer, images: in jedem Rezept gleich · 270 Zeilen
// ─── Kit ── helpers shared by every Cookbook recipe · postext.dev/cookbook ───── // ─── Kit · core v1 ── the same in every recipe · postext.dev/cookbook function mm(value) { return { value, unit: 'mm' }; } function pt(value) { return { value, unit: 'pt' }; } function em(value) { return { value, unit: 'em' }; } /** The sample language's string: t({ en: 'Figure', es: 'Figura' }). */ function t(strings) { return strings[LANG] ?? Object.values(strings)[0]; } /** A file in this recipe's assets folder, served from the Postext repo by jsDelivr. */ function asset(file) { return `https://cdn.jsdelivr.net/gh/drnachio/postext@main/cookbook/${RECIPE}/assets/${file}`; } // ─── Kit · fonts v3 ── the same in every recipe · postext.dev/cookbook // Postext loads the faces a config asks for before layout (prepareFonts, // buildDocumentWithFonts) and asks the kit for the files: Fontsource's, the // files the PDF embeds too. /** The options of buildDocumentWithFonts / prepareFonts / withLoadedFonts: * the Fontsource resolver, and the faces of FONTS loaded with the ones the * config names. FONTS = { 'Family Name': ['400', '400i', '700'] }. */ function kitFonts(FONTS = {}) { const faces = Object.entries(FONTS).flatMap(([family, specs]) => specs.map((spec) => ({ family, weight: parseInt(spec, 10), style: spec.endsWith('i') ? 'italic' : 'normal' }))); return { resolve: fontsourceResolver, faces }; } /** A face's Fontsource files, in a fixed order: latin, then latin-ext and greek * when `text` needs them and the family ships them (kitSubsetsFor), each with * its unicode-range. Null for a weight or slant Fontsource does not ship. */ async function fontsourceResolver(family, weight, style, { text = '' } = {}) { const id = fontsourceId(family); const meta = await fontsourceMeta(family); if (meta && !(meta.weights.includes(weight) && meta.styles.includes(style))) return null; kitStatus('Loading fonts…'); const at = await fontsourceAt(id); return ['latin', ...kitSubsetsFor(text, meta)].map((subset) => ({ source: `${at}files/${id}-${subset}-${weight}-${style}.woff2`, unicodeRange: kitRanges()[subset], })); } /** The unicode-range of each Fontsource file the kit loads (a function: the * kit is inlined after the pen's code, which runs before a const would be set). */ function kitRanges() { return { latin: 'U+0000-00FF,U+0131,U+0152-0153,U+02BB-02BC,U+02C6,U+02DA,U+02DC,U+0304,U+0308,U+0329,' + 'U+2000-206F,U+20AC,U+2122,U+2191,U+2193,U+2212,U+2215,U+FEFF,U+FFFD', 'latin-ext': 'U+0100-02BA,U+02BD-02C5,U+02C7-02CC,U+02CE-02D7,U+02DD-02FF,U+0304,U+0308,U+0329,' + 'U+1D00-1DBF,U+1E00-1E9F,U+1EF2-1EFF,U+2020,U+20A0-20AB,U+20AD-20C0,U+2113,U+2C60-2C7F,U+A720-A7FF', greek: 'U+0370-03FF', }; } /** For the cjk, arabic and comics blocks, which add their own files: the * faces of `faces` = { 'Family Name': ['400', '400i', '700'] }. `text` is the sample: * č ł † α χ also load latin-ext and greek files (kitSubsetsFor). With * `optional`, a face Fontsource does not ship is skipped instead of failing. * The files are added once all have loaded, in the order asked (latin, then * latin-ext, then greek), whatever order they arrive in: the last one added * wins a character two files hold. Resolves to the number of faces added. */ async function loadFonts(faces, text = '', { optional = false } = {}) { kitStatus('Loading fonts…'); const ranges = kitRanges(); const jobs = []; for (const [family, specs] of Object.entries(faces)) { const id = fontsourceId(family); const todo = [...new Set(specs)].map((spec) => [parseInt(spec, 10), spec.endsWith('i') ? 'italic' : 'normal']) .filter(([weight, style]) => !hasFace(family, weight, style)); // before any await const at = fontsourceAt(id); const meta = optional || /[^\0-ÿ]/u.test(text) ? await fontsourceMeta(family) : null; const subsets = ['latin', ...kitSubsetsFor(text, meta)]; for (const [weight, style] of todo) { if (optional && !(meta?.weights.includes(weight) && meta.styles.includes(style))) continue; for (const subset of subsets) { const url = `${await at}files/${id}-${subset}-${weight}-${style}.woff2`; const face = new FontFace(family, `url(${url}) format('woff2')`, { weight: String(weight), style, unicodeRange: ranges[subset] }); jobs.push(face.load().catch(() => { if (subset === 'latin' && !optional) throw new Error(`Fontsource has no ${family} ${weight} ${style}`); })); } } } const ready = await Promise.all(jobs).catch((error) => { kitFail(error); throw error; }); return ready.filter((face) => face && document.fonts.add(face)).length; } /** A loaded FontFace covers this family, weight and style (fonts.check() would * also say yes for families nobody declared). */ function hasFace(family, weight, style) { for (const face of document.fonts) { if (face.status !== 'loaded' || face.style !== style) continue; if (face.family.replace(/^["']|["']$/g, '') !== family) continue; const [low, high = low] = face.weight.split(' ').map(Number); if (weight >= low && weight <= high) return true; } return false; } /** The files beyond latin `text` needs that `meta`'s family ships. */ function kitSubsetsFor(text, meta) { return [[/[Ā-˿ᴀ-ᶿḀ-ỿ†ℓⱠ-Ɀ꜠-ꟿ]/u, 'latin-ext'], [/[Ͱ-Ͽ]/u, 'greek']] .filter(([re, x]) => re.test(text) && meta?.subsets?.includes(x)).map(([, x]) => x); } /** Fontsource's id for a family: 'Source Serif 4' → 'source-serif-4'. */ function fontsourceId(family) { return family.toLowerCase().replace(/\s+/g, '-'); } /** A package's folder at the one version @5 names now (#766). */ function fontsourceAt(id, u = `https://cdn.jsdelivr.net/npm/@fontsource/${id}@`) { return (fontsourceAt.c ??= {})[id] ??= fetch(u + '5/package.json').then((r) => r.json()) .then((p) => p.version || 5, () => 5).then((v) => `${u}${v}/`); } /** The family's Fontsource metadata (weights, styles, subsets), or null. */ function fontsourceMeta(family) { fontsourceMeta.cache ??= new Map(); const id = fontsourceId(family); if (!fontsourceMeta.cache.has(id)) { fontsourceMeta.cache.set(id, fetch(`https://api.fontsource.org/v1/fonts/${id}`) .then((res) => (res.ok ? res.json() : null), () => null)); } return fontsourceMeta.cache.get(id); } // ─── Kit · viewer v2 ── the same in every recipe · postext.dev/cookbook /** The pages as spreads on a dark desk, page 1 alone, then verso | recto, * each painted when it scrolls near. Other options go to renderPageToCanvas. */ function showPages(docs, { title, width = 460, ...render } = {}) { const root = viewer(title); const pages = [docs].flat().flatMap((doc) => doc.pages.map((page) => ({ doc, page, n: (doc.pageIndexOffset ?? 0) + page.index }))); const spreads = []; let verso = null; for (const p of pages) { if (p.n % 2 === 1) { if (verso) spreads.push([verso, null]); verso = p; } else { spreads.push([verso, p]); verso = null; } } if (verso) spreads.push([verso, null]); const density = Math.min(window.devicePixelRatio || 1, 2); showPages.painter?.disconnect(); const painter = new IntersectionObserver((entries) => { for (const { isIntersecting, target } of entries) { if (!isIntersecting) continue; painter.unobserve(target); const { doc, page } = target.postext; renderPageToCanvas(page, doc, target, { ...render, scale: (width * density) / page.width }); } }, { rootMargin: '800px' }); showPages.painter = painter; root.replaceChildren(...spreads.map((pair) => { const spread = document.createElement('div'); spread.className = 'pt-spread'; for (const p of pair) { const figure = document.createElement('figure'); if (p) { const label = p.page.pageLabel || String(p.n + 1); const canvas = document.createElement('canvas'); canvas.postext = p; canvas.style.aspectRatio = `${p.page.width} / ${p.page.height}`; canvas.setAttribute('role', 'img'); canvas.setAttribute('aria-label', `Page ${label}`); const folio = document.createElement('figcaption'); folio.textContent = label; figure.append(canvas, folio); painter.observe(canvas); } else figure.className = 'pt-blank'; spread.append(figure); } return spread; })); kitStatus(`${pages.length} ${pages.length === 1 ? 'page' : 'pages'}`); document.documentElement.dataset.postext = 'ready'; return pages.length; } /** The desk, the bar and the error reporting, created once. */ function viewer(title) { if (!document.getElementById('pt-kit')) { document.head.insertAdjacentHTML('beforeend', `<style id="pt-kit"> :root { color-scheme: dark; } body { margin: 0; background: #0e1014; color: #b9bcc4; font: 13px/1.45 system-ui, sans-serif; } #pt-bar { position: sticky; top: 0; z-index: 1; display: flex; flex-wrap: wrap; align-items: center; gap: 6px 16px; padding: 10px 16px; background: rgb(14 16 20 / .92); backdrop-filter: blur(6px); border-bottom: 1px solid #23262d; } #pt-bar strong { color: #f4f1ea; font-weight: 600; } #pt-actions { display: flex; gap: 12px; margin-left: auto; } #pt-actions a, #pt-actions button { color: #d8a21a; font: inherit; background: none; border: 0; padding: 0; cursor: pointer; } #pages { display: grid; justify-items: center; gap: 48px; padding: 32px 16px 72px; } .pt-spread { display: flex; } .pt-spread figure { margin: 0; width: min(460px, 44vw); } .pt-spread canvas { display: block; width: 100%; background: #fff; box-shadow: 0 1px 2px rgb(0 0 0 / .5), 0 22px 44px -16px rgb(0 0 0 / .8); } .pt-spread figure:first-child canvas { box-shadow: inset -14px 0 14px -14px rgb(0 0 0 / .18), 0 1px 2px rgb(0 0 0 / .5), 0 22px 44px -16px rgb(0 0 0 / .8); } .pt-spread figcaption { margin-top: 10px; text-align: center; font: 600 10px/1 system-ui, sans-serif; letter-spacing: .18em; text-transform: uppercase; color: #6c7079; } .pt-blank { visibility: hidden; } @media (max-width: 760px) { .pt-spread { flex-direction: column; gap: 32px; } .pt-spread figure { width: min(460px, 92vw); } .pt-blank { display: none; } } </style>`); document.body.insertAdjacentHTML('afterbegin', '<header id="pt-bar"><strong id="pt-title"></strong><span id="pt-status" role="status"></span><span id="pt-actions"></span></header>'); document.getElementById('pt-title').textContent = document.title || 'Postext'; addEventListener('error', (event) => kitFail(event.error ?? event.message)); addEventListener('unhandledrejection', (event) => kitFail(event.reason)); } if (title) document.getElementById('pt-title').textContent = title; return document.getElementById('pages') ?? document.body.appendChild(Object.assign(document.createElement('main'), { id: 'pages' })); } function kitStatus(text) { viewer(); document.getElementById('pt-status').textContent = text; } function kitFail(error) { document.documentElement.dataset.postext = 'error'; kitStatus(`Error: ${error?.message ?? error}`); } // ─── Kit · images v3 ── recipes with pictures · postext.dev/cookbook /** Registers a photo or PNG for the canvas and keeps its bytes for the PDF. * fetch → ImageBitmap never taints the canvas (a plain cross-origin <img> would). */ async function loadImage(fileId, url) { const res = await fetch(url); if (!res.ok) throw new Error(`Image not found (${res.status}): ${url}`); const bytes = new Uint8Array(await res.arrayBuffer()); registerResourceImage(fileId, await createImageBitmap(new Blob([bytes]))); (loadImage.bytes ??= new Map()).set(fileId, bytes); } /** Registers SVG markup as a vector image, its fonts inside (inlineSvgFonts, ≥ 1.25). * `options` go to registerResourceImage: { singleInk: true } tints it on the canvas. */ async function loadSvg(fileId, svg, options) { if (typeof inlineSvgFonts === 'function') svg = await inlineSvgFonts(svg, svgFaces); const img = new Image(); img.src = `data:image/svg+xml;charset=utf-8,${encodeURIComponent(svg)}`; await img.decode(); registerResourceImage(fileId, img, options); (loadImage.bytes ??= new Map()).set(fileId, new TextEncoder().encode(svg)); } /** A face's Fontsource files: nearest weight; latin + what the SVG sets. */ async function svgFaces(family, weight, style, { codePoints = [] } = {}) { const [id, m] = [fontsourceId(family), await fontsourceMeta(family)]; const w = m?.weights.reduce((a, b) => (Math.abs(b - weight) < Math.abs(a - weight) ? b : a)) ?? weight; const s = m?.styles.includes(style) === false ? 'normal' : style; return Promise.all(['latin', ...kitSubsetsFor(String.fromCodePoint(...codePoints), m)].map(async (x) => new Uint8Array( await (await fetch(`${await fontsourceAt(id)}files/${id}-${x}-${w}-${s}.woff2`)).arrayBuffer()))); } /** renderToPdf({ resourceBytes: imageBytes }) */ function imageBytes(fileId) { return loadImage.bytes?.get(fileId); } /** renderToHtml({ resourceImageUrl: imageUrl }) */ function imageUrl(fileId) { const bytes = imageBytes(fileId); if (!bytes) return undefined; imageUrl.urls ??= new Map(); if (!imageUrl.urls.has(fileId)) { const type = /\.svg$/i.test(fileId) ? 'image/svg+xml' : /\.png$/i.test(fileId) ? 'image/png' : 'image/jpeg'; imageUrl.urls.set(fileId, URL.createObjectURL(new Blob([bytes], { type }))); } return imageUrl.urls.get(fileId); } // ─── /Kit ───────────────────────────────────────────────────────────────────────
Das zusammengesetzte script.js läuft unverändert: Fügen Sie es in das Modulskript einer beliebigen Seite ein, oder öffnen Sie das Rezept auf CodePen. Ordner des Rezepts auf GitHub ↗ (öffnet in neuem Tab)
Varianten
#Das E-Poster mit 150 dpi exportieren
Eine Tagung, die eine größere Datei verlangt, erhält ein PNG von 3.543 × 4.724 px mit denselben Zeilenumbrüchen.
-  dpi: 72, backgroundColor: col('paper'),
+ dpi: 150, backgroundColor: col('paper'),Häufige Fehler
- Rethink Sans zeichnet eine einzelne Ziffer in Klammern, etwa die Heftnummer in 11(3), auf dem Canvas als eingekreiste Ziffer; die Literaturangaben nennen daher nur Band und Seiten.
- Ein seitenbreiter Kasten, der das Dokument beendet, rückt auf eine neue Seite, wenn darunter nicht zwei Grundtextzeilen Platz bleiben. Der Schlagwortstreifen gleitet daher mit
placement="bottom", was ihn auf den unteren Rand setzt, in die 50 mm, die unter dem Raster bleiben. containerSpacing: 'add'an den Formatenstatundrefsbeendet ihre Gruppen:::paragraphsmit dem eigenen Abstand des Formats, was −4,2 °C auf der Zeile hält, die es erklärt; jede andere Gruppe des Posters folgt der Regel des Dokuments (seit postext 1.28; davor ließ sich die Regel nur für das ganze Dokument setzen, mitbodyText.paragraphContainerSpacing). Unter der letzten Literaturangabe ist dieser Abstand dasspaceBetweendes Formats, 2,8 mm, sodass ein:::space{lines=0.75}vor der Danksagung 10,8 mm öffnet, nahe an den 10,6 mm zwischen den anderen Absätzen eines Panels. Ohne ihn, unter dem'collapse'des Dokuments, folgt einer Gruppe eine Zeile des Absatzabstands des Panels: Die Danksagung braucht kein:::space, aber die Zeile, die das unter −4,2 °C hinzufügt, schiebt den Schlagwortstreifen auf eine zweite Seite.
Nachweise
- Rezept
- Ignacio Ferro
- Text
- Eigener Text, CC BY 4.0
- Bilder
- The plan of the street, the heat map, the bar chart and the School of Geography's mark, drawn in code from synthetic data in the poster's palette · Ignacio Ferro · CC BY 4.0
- Schriften
- Rethink Sans (SIL OFL 1.1) · Bitter (SIL OFL 1.1) · Saira Condensed (SIL OFL 1.1)
- Code
- MIT, wie Postext
Diesen Text bearbeiten ↗ (öffnet in neuem Tab)Ordner des Rezepts auf GitHub ↗ (öffnet in neuem Tab)